This is the Internet Report, where we analyze outages and trends across the Internet, from the previous two weeks, through the lens of ThousandEyes Internet and Cloud Intelligence. I’ll be here every other week, sharing the latest outage numbers and highlighting a few interesting outages. As always, you can read the full analysis below or tune in to the podcast for firsthand commentary.
Internet Outages & Trends
Variability in the detail and utility of official status pages has long reinforced the value of having an independent view of third-party cloud services and applications. It is not uncommon for an outage not to be immediately reflected on the official status page—there may be a significant lag between when customer-facing impact is felt and the issue is acknowledged. Additionally, the outage may be acknowledged on social media channels well before it is reflected on the official status page.
Why this gap? Why don’t businesses configure their status pages to automatically update in real-time? While the answer may vary from outage to outage and company to company, one typical reason is quite understandable: Support teams may want to have a window of time to troubleshoot before they manually change the operating status and notify customers of the presence of an issue.
And sometimes, an outage may even take a status page completely offline. This was more common in the past, when status pages were more likely to be hosted on the same set of infrastructure as the main service. However, an even less common scenario occurred this past fortnight during a Salesforce outage, where the volume of customers hitting the status page seeking answers on why their apps were down was flagged as malicious, triggering denial-of-service protections—and pushing customers elsewhere for answers.
This is to say that independent visibility into cloud and application estates remains as important as ever. Services will inevitably experience problems. The quickest path to actionable information in the event of an outage is to have visibility across your entire service delivery channel and not rely solely on the official channels.
Read on to learn more about the Salesforce outage, as well as a recent Microsoft disruption, or use the links below to jump to the sections that most interest you:
Salesforce Outage
Status Page Issues
On October 1, Salesforce users in multiple regions began experiencing issues with the application. When they tried to investigate what might be going on, users in Europe and Asia Pacific found that the company’s Trust dashboard and Status URLs were inaccessible.
It turned out that the “spike in traffic” from users was mistakenly interpreted by a third-party application firewall sitting in front of the Trust and Status pages as a denial-of-service attack. That led to the blocked user traffic.
“A gap in monitoring prevented the existing auto-remediation process, which resulted in traffic from the EMEA and APAC regions receiving an error on the UI (User Interface),” Salesforce wrote in their post-incident report. “The UI in the AMER region, the APIs (application programming interface) in all regions, and notification functionality were not impacted.”
Users were eventually able to see the status updates as their traffic was redirected to avoid the firewall block.
These status page issues illustrate why NetOps teams can’t exclusively rely on status pages and official company updates. These might be delayed, incomplete, or fail entirely for various reasons. Instead, teams should consider a variety of data points, combined from all the resources and metrics they have access to. To enable this holistic view, businesses should ideally have their own comprehensive monitoring in place for both owned and unowned services.
What Caused the Salesforce Outage?
So, what could have caused the Salesforce app outage in the first place? Let’s apply this holistic approach and see what we can discover. Then, we’ll examine Salesforce’s official post-incident report and see if it confirms our hypothesis.
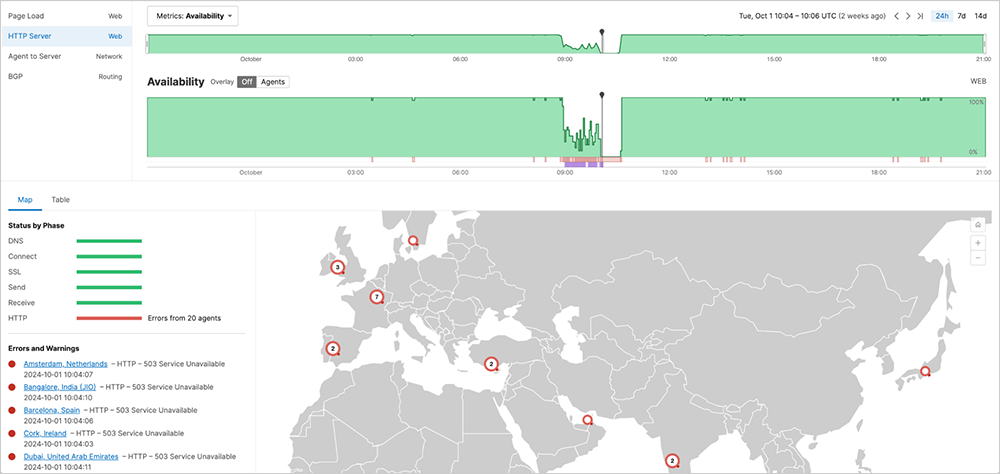
Users in multiple regions encountered issues that caused the Salesforce app to either fail at startup or experience degraded performance.
As the incident progressed, it was characterized by a distinctive castellation pattern of disruptions. This pattern, when considered in relation to the number of affected servers, indicated degradation and intermittent success as customers tried to load different parts of the application.

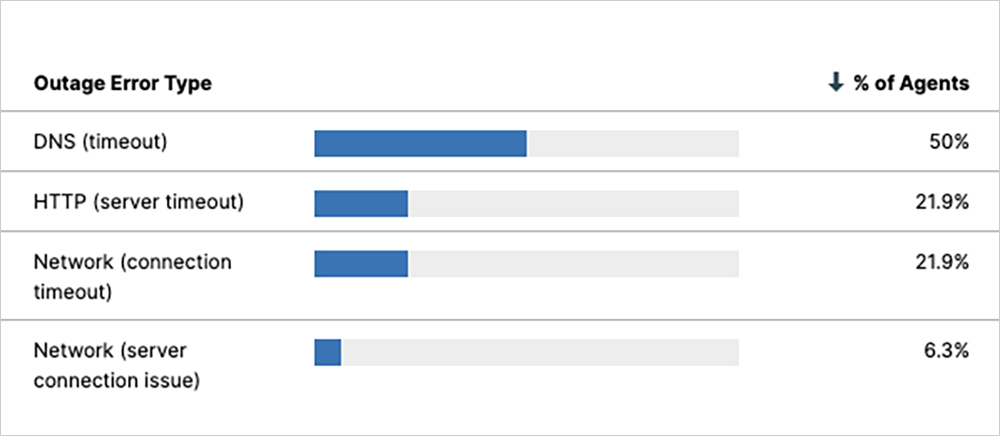
Initially seen as service timeouts, the outage progressively escalated to a full outage that manifested as 503 service unavailable errors. As the 5xx errors are essentially server-side errors, they point to the issue lying with backend services, as they indicate that the request reached at least the front door but was unable to be accommodated.

ThousandEyes’ analysis of network paths confirmed that customers were able to reach Salesforce infrastructure without issues. Rather, a server-side error prevented application components from loading and data requests from being fulfilled.

Explore the Salesforce outage further in the ThousandEyes platform (no login required).
Salesforce’s post-incident report confirmed that the issue was indeed a server-side error caused by absent metadata in an encryption key configuration.
According to the report, a time-specific configuration prevented core app servers from starting up, beginning midnight (UTC) on October 1. Technology teams were alerted to issues with a handful of sandbox instances a few hours later, but there was no customer impact at that time. It wasn’t until 6:45 AM (UTC) that Asia Pacific customers began reporting problems—beginning as degradations before progressing to a “lights on, lights off” scenario as users received 500 errors due to infrastructure becoming overloaded.
Salesforce noted that its live production app servers restart as part of routine operations. “During this incident, the missing configuration prevented the app startup, and reduced the capacity of the fleet… Further environments were impacted as additional app server restarts took place.”
Metadata associated with the configuration was missing because engineers assumed it was no longer necessary in the new encryption key management system they were using. Tests weren’t in place for the specific scenario, and automated alerting “did not warn the Technology team ahead of time that … functionality was about to break.”
Manual intervention “to suppress restarts and add the missing metadata mitigated the impact” until an emergency release could be pushed out. This took around 14 hours to complete.
Microsoft Outlook Outage
Salesforce wasn’t the only enterprise service to experience disruptions in the past fortnight. Microsoft 365 users in Europe encountered issues with Outlook—specifically in relation to the associated desktop app—on October 10 at 12:28 PM (UTC) that manifested as crashes, high memory usage, and as emails not being received. These problems appeared as accessibility timeout conditions from a network perspective.

The nature of the observations pointed toward the potential cause being on the application side. This was confirmed by the absence of any significant network conditions coinciding with the outage.

Microsoft engineers investigated the issues and uncovered a “memory management issue” associated with “the New Outlook desktop app.”
This was remediated with a “targeted configuration update” that was applied by Microsoft engineers about five hours later, and by users restarting their Outlook sessions.
However, according to reports from some users, it appeared some memory issues extended after the outage was declared officially mitigated.
By the Numbers
Let’s close by taking a look at some of the global trends ThousandEyes observed across ISPs, cloud service provider networks, collaboration app networks, and edge networks over recent weeks (September 30 - October 20):
-
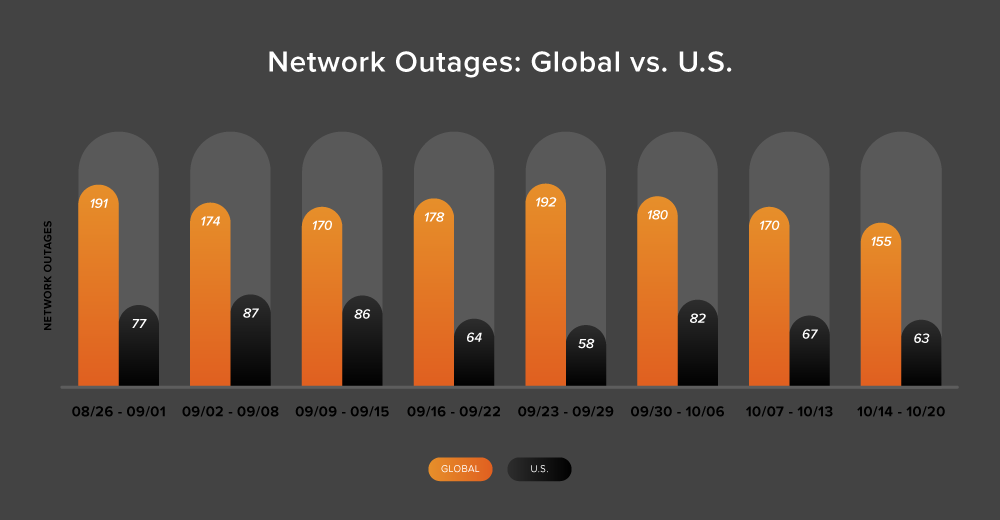
The downward trend in mid-August returned from September 30 to October 20, with the total number of global outages decreasing. In this period’s first week, ThousandEyes observed a 6% decrease, with outages dropping from 192 to 180. This trend continued into the following weeks. Between October 7 and 13, outages decreased from 180 to 170, marking a 6% decrease compared to the previous week. This was followed by a further decrease of 9% the next week, with outages dropping from 170 to 155.
-
The United States followed a slightly different pattern during this three-week period. Outages initially increased, rising by 41% during the first week (September 30 - October 6). However, the rest of the period saw decreases, with an 18% drop from 82 to 67 the second week (October 7-13), and a further 6% decrease the following week (October 14-20), with outages falling from 67 to 63.
-
During the recent period from September 30 to October 20, an average of 42% of all network outages occurred in the United States, which is an increase from 33% in the previous period (September 16 to 29). This shows a return to the previously observed pattern, where U.S.-centric outages typically accounted for at least 40% of all observed outages.
-
Looking at the recent month-over-month outage trends, in September, 763 outages were observed worldwide, a 14% decrease from the 888 reported in August. In the U.S., outages also decreased by 20%, dropping from 387 in August to 308 in September. This pattern mirrors the trend seen in 2023, when total global and U.S. outages also decreased between August and September.
