Turn Data Into Actionable Intelligence
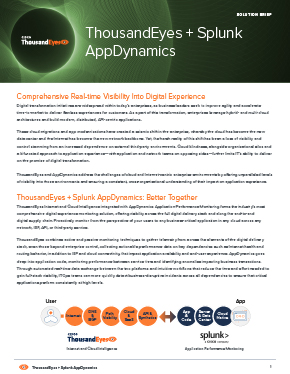
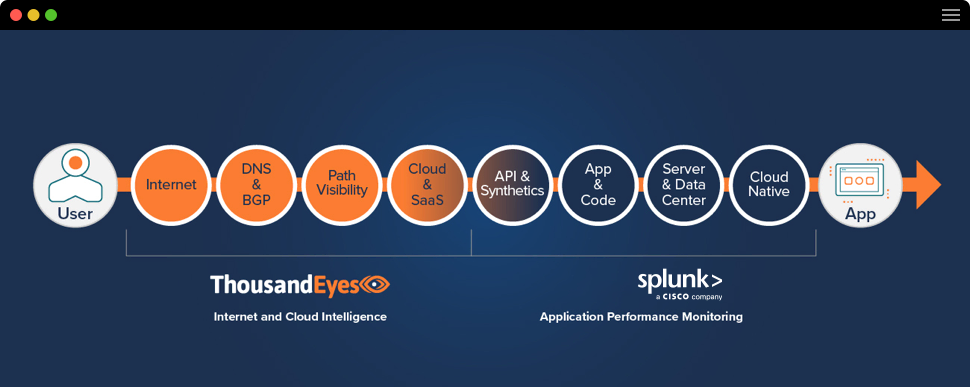
ThousandEyes Internet and Cloud Intelligence and Splunk AppDynamics’ Application Performance Monitoring integrate in a seamless, automated fashion to produce a digital experience monitoring solution with unmatched visibility into the end-to-end digital supply chain. Proactively monitor from your end-users’ perspectives across any network to any application hosted anywhere, including all internal and external dependencies—BGP and DNS infrastructure, APIs, and cloud services—critical to application availability and performance.
ThousandEyes combines active and passive monitoring techniques to gather telemetry from across the elements of the digital delivery stack, even elements that enterprises don’t control, collecting actionable performance data on key dependencies, such as Internet health and routing behavior in addition to ISP and cloud connectivity, that impact application availability and end-user experience. AppDynamics goes deep into application code, monitoring performance between service tiers and identifying anomalies impacting business transactions. Through automated real-time data exchange between the two platforms, and intuitive workflows that reduce the time and effort needed to gain full-stack visibility, ITOps teams are able to more quickly detect business-disruptive incidents across all dependencies to ensure that critical applications perform consistently at high levels.
Complete End-to-End Service Visibility
The integration between ThousandEyes and AppDynamics is part of Splunk’s full-stack observability solution, solving the end-to-end service visibility challenge by providing deep insights into every dependency and every transaction of a complex digital service delivery supply chain.
Proactive and Unified Visibility Into Application Experience
- Proactively monitor application performance and Internet connectivity from ThousandEyes vantage points representing user locations from more than 200 cities around the globe to the application front door.
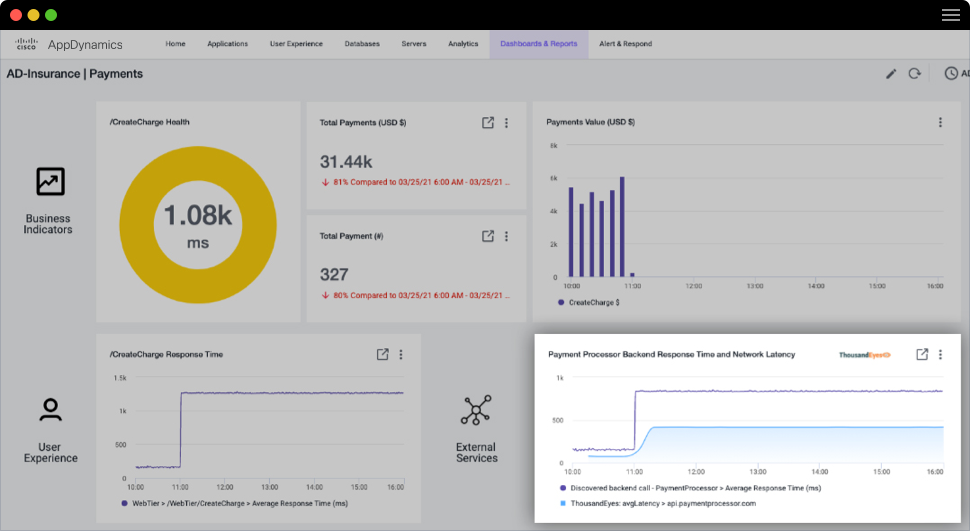
- Automatically overlay ThousandEyes “outside-in” Internet visibility with application and infrastructure metrics from AppDynamics on either platform to visually correlate performance and quickly isolate application issues from underlying network disruptions, including at the services or transaction level.
- Extend visibility into hybrid- and multi-cloud deployments to test backend application interactions and dependencies with external third-party APIs or cloud-based services.
Prove Network Innocence With Correlated Insights
Eliminate finger-pointing across AppOps and NetOps teams. With ThousandEyes and Splunk AppDynamics Bi-directional Integration, you get application and business performance data correlated with network and Internet performance metrics in a holistic view across both platforms to quickly determine root cause. Easily understand and visualize the business impact of outages with Splunk AppDynamics, facilitating prioritization of network incidents and improving overall operational efficiency. With ThousandEyes and Splunk AppDynamics, you can more quickly and seamlessly unify triaging workflows between operation teams.
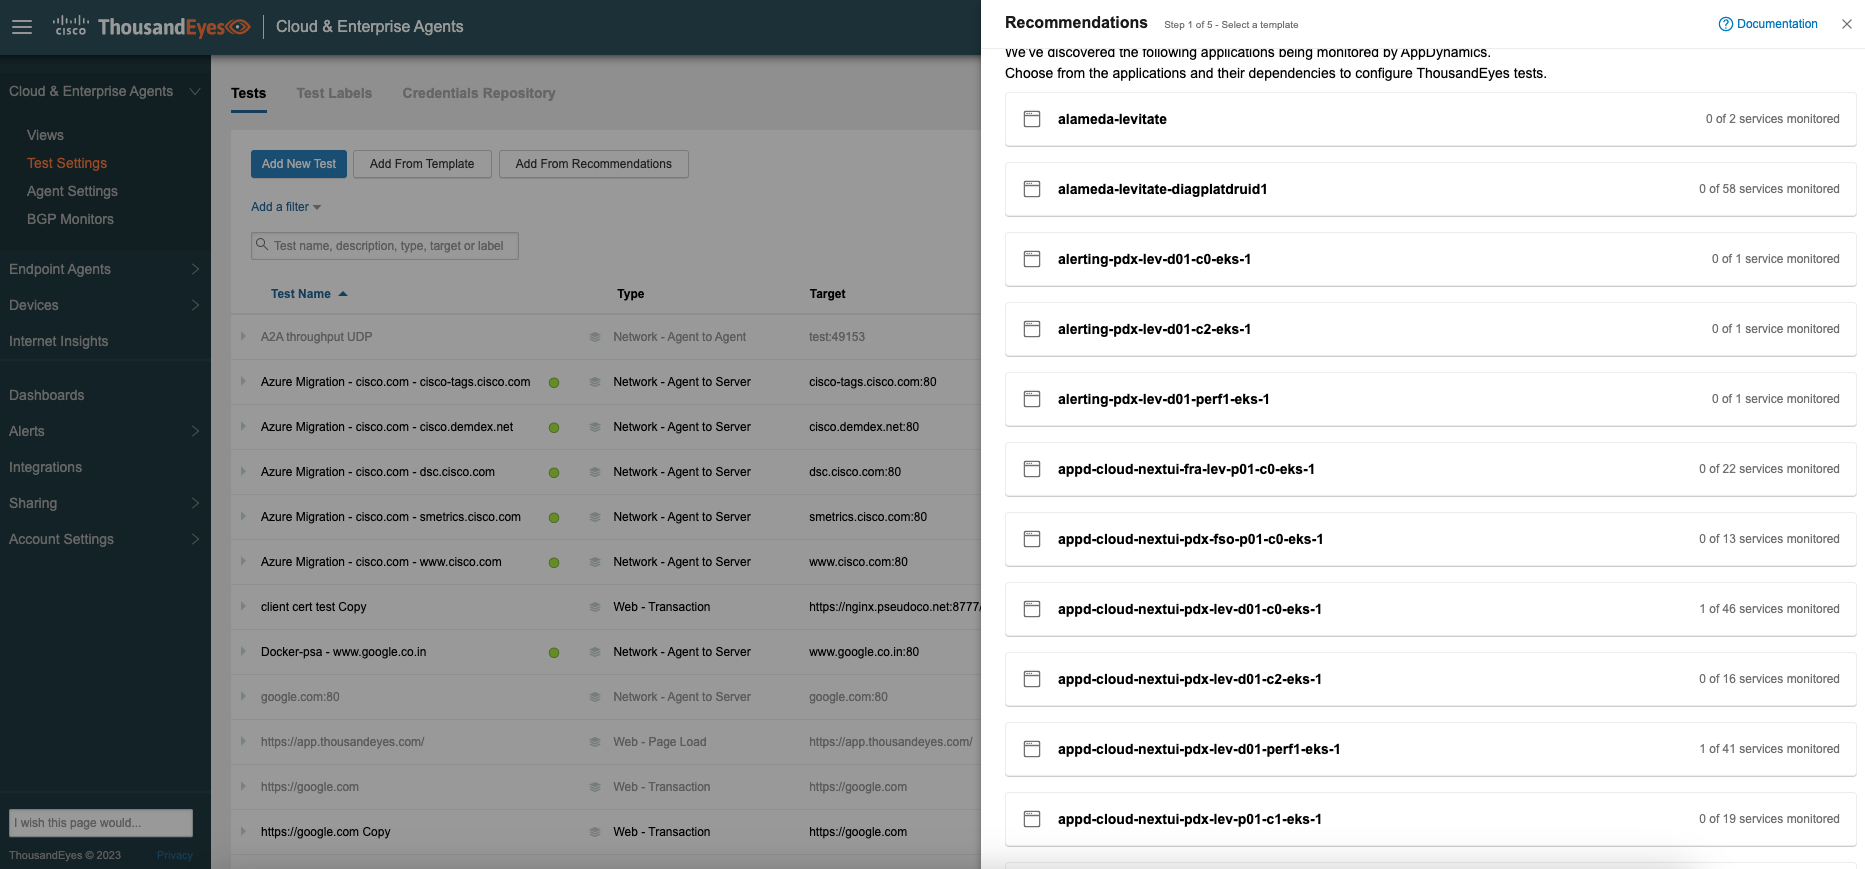
Proactively Identify and Eliminate Monitoring Gaps
By integrating network performance data from ThousandEyes, Splunk AppDynamics customers can gain a comprehensive understanding of every dependency that contributes to the performance of their applications. With monitoring recommendations and pre-configured test templates, you can easily align monitoring to your specific use cases and deploy ThousandEyes tests from within your Splunk AppDynamics dashboard. This enables you to take a more proactive approach to monitoring and troubleshooting, helping you to identify and resolve issues before they impact your users.
See How ThousandEyes and AppDynamics Work Together Seamlessly
Watch this demo to learn how ThousandEyes' bi-directional integration with AppDynamics enables IT to streamline workflows and uncover hidden app dependencies.
Why ThousandEyes + AppDynamics?
See and understand every dependency that contributes to application performance.
Collaborate across IT teams using a common operating language.
Reduce the time and effort needed for scalable, holistic observability.
Featured Blogs
Gaining End-to-End Application Visibility at a Top 10 Financial Institution
Driving Simplified IT Operations With New ThousandEyes Innovations
Get Comprehensive Visibility Into Application Experience Today
