When folks talk about end user or ‘real user’ monitoring, they usually mean injecting code (often Javascript) into an application to measure user behavior and timing. This can be great to complement an application monitoring strategy. But this sort of method doesn’t work when the application in question isn’t yours (as in the case of Software-as-a-Service apps). This method also fails to provide a detailed understanding of connectivity.
To bridge the gaps in visibility into applications you no longer own and network connectivity which increasingly influences overall user performance, we built Endpoint Agent. Now that Endpoint Agent is generally available, we’ll be penning a few posts about you can put it to use. First up, we’ll dig into how you can monitor SaaS applications with data collected directly from the users of those services.
Choose Your SaaS Applications to Monitor
You likely have a lot of SaaS applications in use in your organization, some deployed to all employees and others used by just a few functions or teams. In general, we find that organizations get value out of monitoring applications that are mission-critical to their business. Here are some popular apps to inventory in your organization:
- Sales and Support: Salesforce, Oracle CRM, Dynamics 365, Zendesk
- HR: Workday, Oracle HCM, SAP SuccessFactors, ADP
- Supply Chain: Oracle ERP and SCM, Coupa
- Finance: NetSuite, Intacct, Xero, Zuora, Ariba, Concur, Docusign
- Collaboration: Office 365, Sharepoint, OneDrive, Google Apps, Box, Dropbox
- ITSM: ServiceNow, Okta, OneLogin, ADFS
Note that Endpoint Agent today monitors the performance of web-based SaaS applications. That means that web interfaces of email, files sync and chat apps will be monitored, but thick clients installed on the OS will not trigger monitoring. Depending on how your team uses applications like Outlook, Dropbox, Box or Skype for Business, keep this in mind.
The Outcomes You Want to Measure
When it comes to monitoring SaaS applications, there are usually two key outcomes you care about: reachability and availability. From these two basic outcomes you can quickly define a checklist of data that can be helpful to validate that both of these are true, and if not, why.
Here is a good starting point for a checklist of SaaS connectivity and availability:
- Can I lookup the domain name?
- Is the DNS query successful?
- How long does it take?
- Can I establish a network (TCP) connection?
- Is there loss? Latency? Jitter? Where in the network?
- Is there a VPN? A proxy? A CDN?
- Is there a route to the destination?
- Can I establish an HTTP connection?
- Does the server respond?
- How long is the response time? Wait time?
- Can I receive data from the server?
- Is the HTTP response successful?
- Did I receive a valid response?
- Beyond the root page, are other pages accessible?
- Can I login?
- Can I retrieve and create data?
- Can I search?
While this may seem like a lot of data to collect, it is critical to understanding what portion of an application or network has a fault, and platforms like ThousandEyes will do the heavy lifting for you.
Two Ways to Monitor SaaS Applications
Monitoring a SaaS application means monitoring a service that you don’t own and can’t directly instrument. Therefore, you have two broad approaches to gather performance data on app and network connectivity:
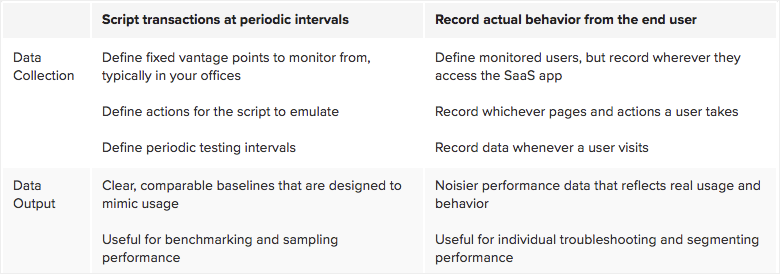
You can use one or both of these approaches to meet your needs. As you can see, they are very complementary. The trade-off exists in how you instrument your monitoring strategy and whether you value clear baselines that may or may not reflect user conditions, or actual user behavior which may or may not be easily or clearly compared over time and users.
Scripting Web Transactions
Web Transaction tests run at preset frequencies, say every 5 minutes, and use a script to take actions on a browser. It’s like having a bunch of users all taking the same actions in the application to benchmark overall performance and find functions that aren’t working as expected, like authentication or search.

In ThousandEyes, scripted Web Transaction tests use open-source Selenium scripts. You can write your own script, import an existing script or record a script directly from your browser using our Recorder. Our Enterprise Agents, software-based sensors that you can place in branch offices, then run these scripts within a browser at defined frequencies. You can also compare this data with Cloud Agents in your area for an external comparison.
Scripted web transactions will give you:
- Completion rates of the full transaction
- Transaction timings overall and per step
- Timings per page
- Page load and DOM load timing
- Object sizes and timings (blocked, DNS, connect, send, wait, receive) on each page

Take a look at previous posts on scripting Basic Web Transactions and Advanced Web Transactions to dive into the details of how to make your transaction scripts effective and resilient against changes in your front-end code.
Recording User Sessions
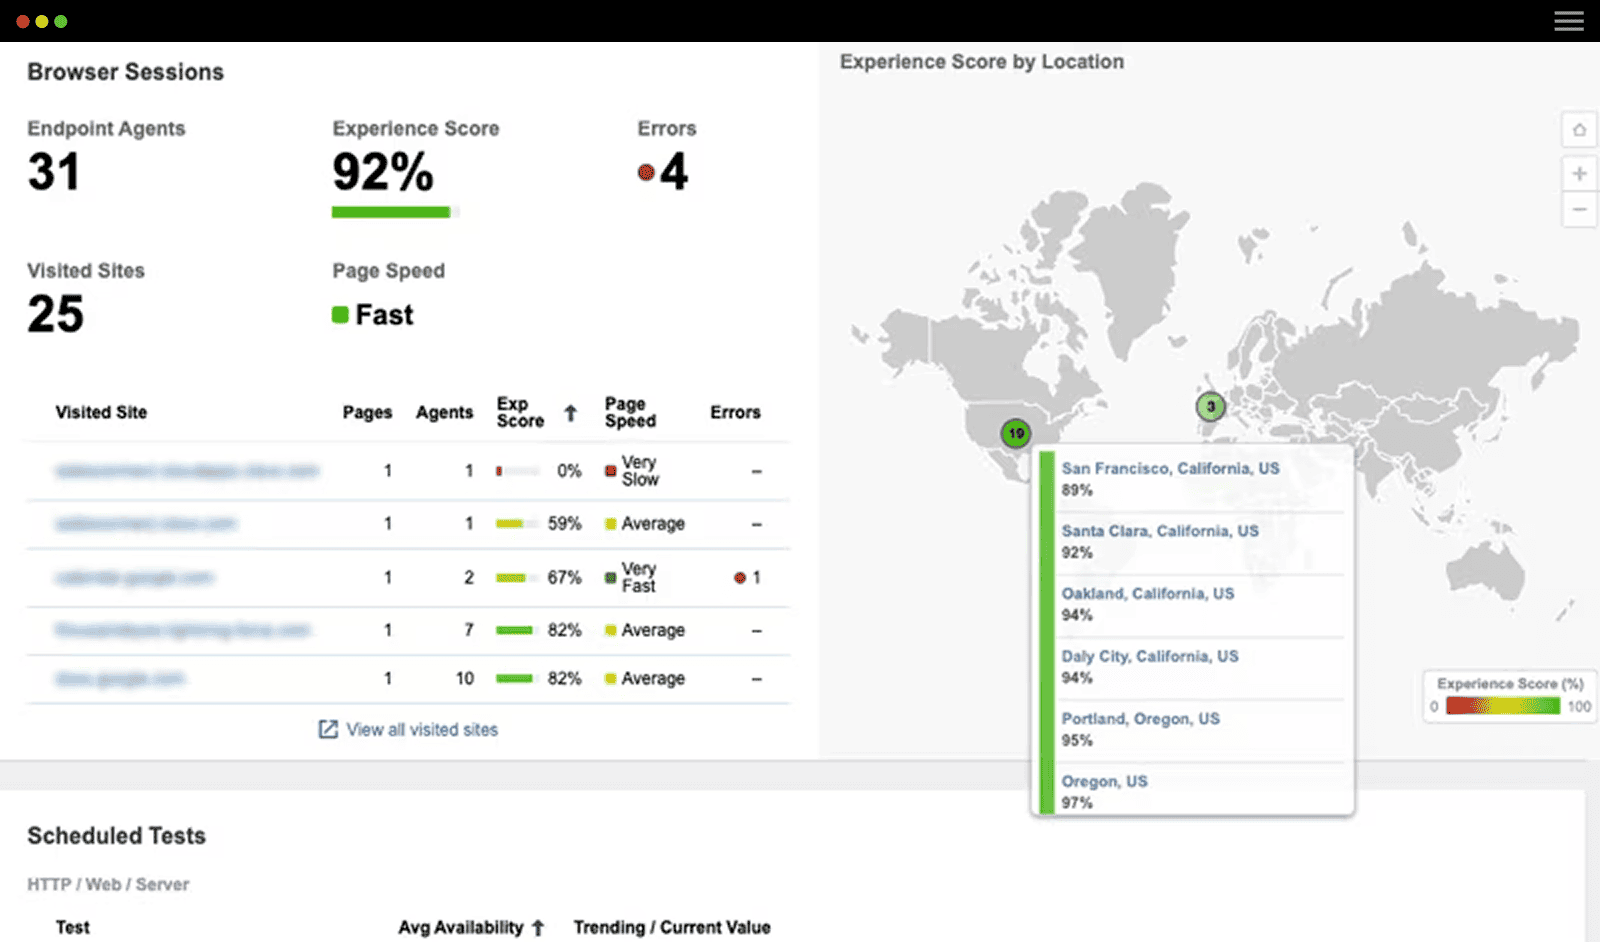
In comparison to scripted web transactions, Endpoint Agents record user sessions directly from a user’s browser. This means that User Session data reflects the actual performance and sequences of users, rather than ‘clean room’ transactions that wipe the cache and take an identical sequence of events each time. You should therefore expect much more variability in User Session data: for example, when a user wanders outside of wireless range or already has a large file cached in their browser. But it is exactly this variability that makes it useful for troubleshooting individual sessions and interpreting aggregate performance data.

You define exactly which domains (SaaS or on-premises applications) and networks are monitored. Within these bounds, recorded User Sessions capture the following data:
- Number of sessions and pages per user
- Page success rate
- Page response time
- Page load and DOM load timing
- Object sizes and timings (wait, receive) on each page
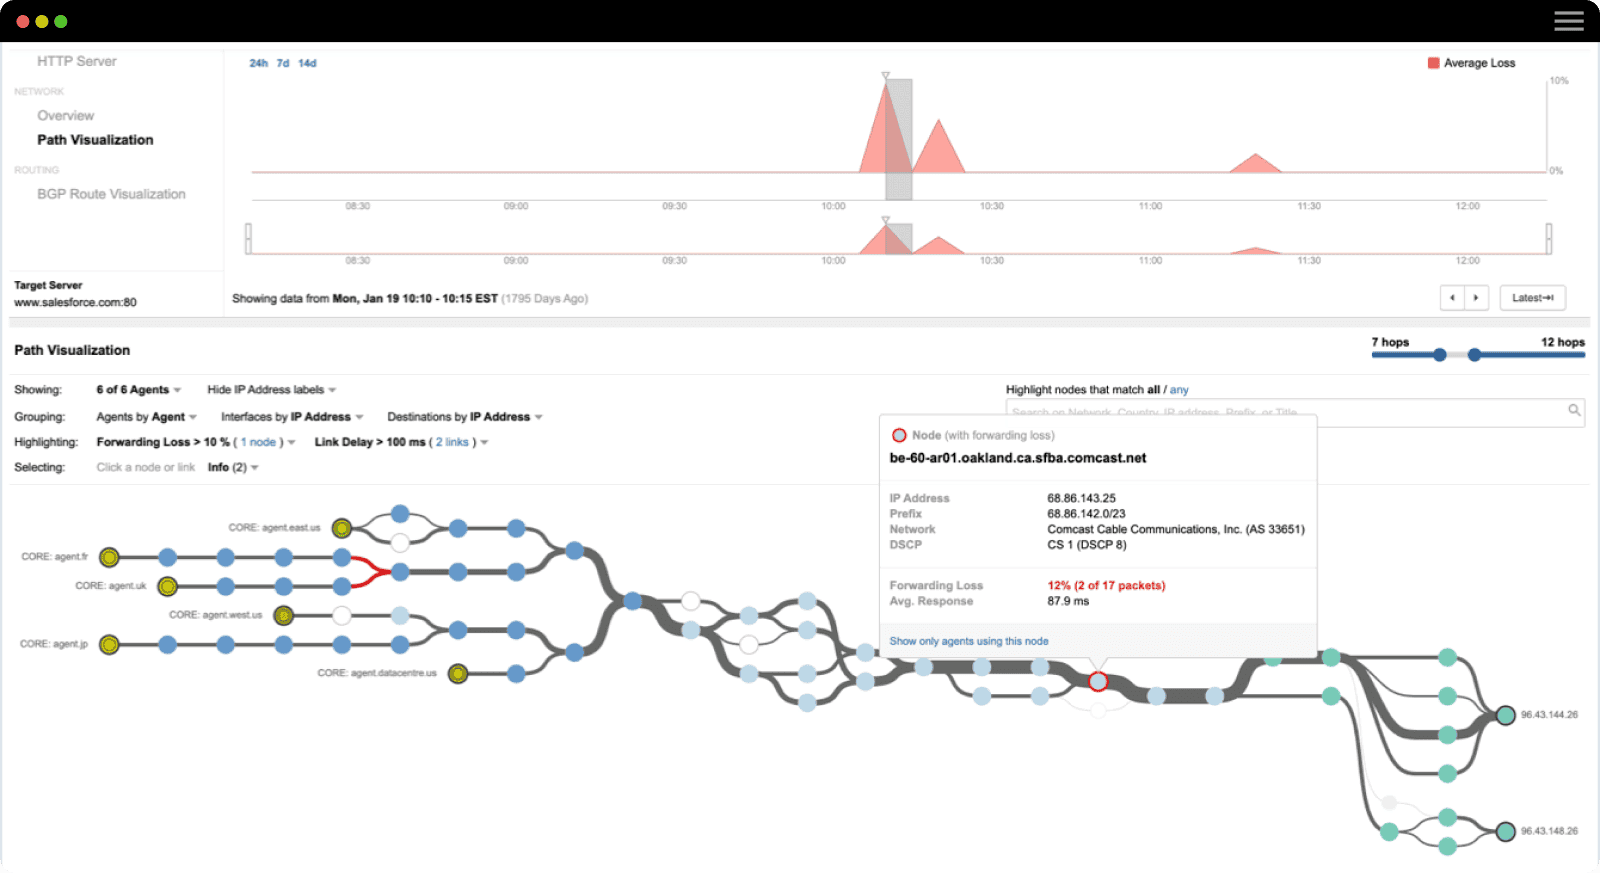
- Loss, latency, jitter and connection path for each session
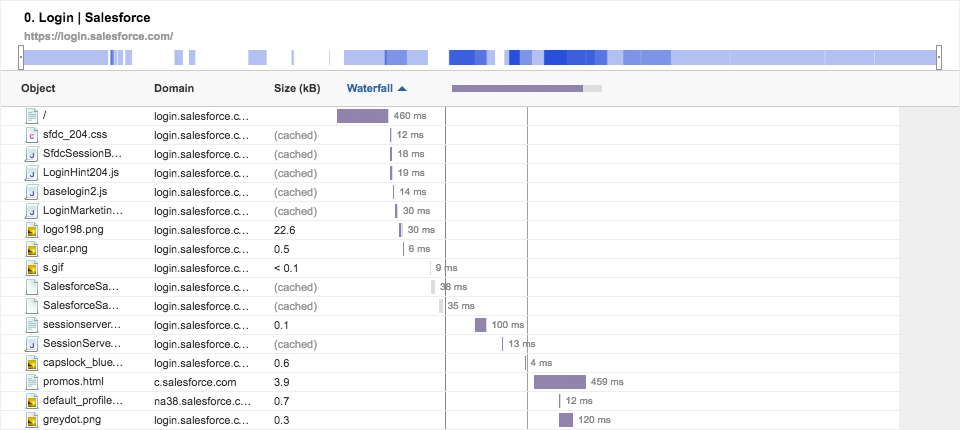
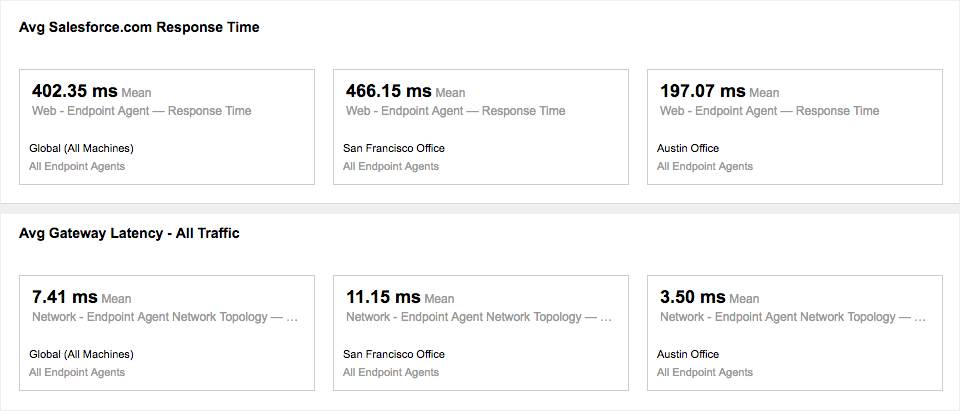
With Endpoint Agent data, you’ll likely also want to use reports to aggregate data over longer periods of time and over many users to understand overall performance. Each of the metrics listed above can be sliced in various ways to create reports, such as in Figure 5.
Monitoring Your SaaS Applications
With the two approaches above, you’ll have your bases covered when it comes to troubleshooting, benchmarking and monitoring performance. But let’s face it, each SaaS application can be very different in how it functions and performs. With that in mind, stay tuned in the coming weeks for tips on monitoring specific SaaS applications such as Salesforce, Dynamics 365, Office 365 and WebEx.
