Beginning at 10:55pm Pacific on May 3, 2016, the Level 3 network experienced severe network issues across several coastal locations in the U.S. and the U.K. The incident was mentioned on the Outages mailing list at outages.org, and by the time the issues ended around 12:05am over an hour later, a long list of services had been affected, including Cisco, Salesforce, SAP SuccessFactors, Viacom and New York Life. Feel free to follow along with our share link from a test to one of Salesforce’s European endpoints, which is representative of the issues we saw in the Level 3 network.
Widespread Packet Loss
We saw similar symptoms across a wide range of tests — Cloud Agents in specific locations experienced severe packet loss issues accompanied by availability issues in those same locations. Because issues were isolated to a handful of locations and because no changes occurred on the routing layer, the root cause is most likely strictly a network layer problem.
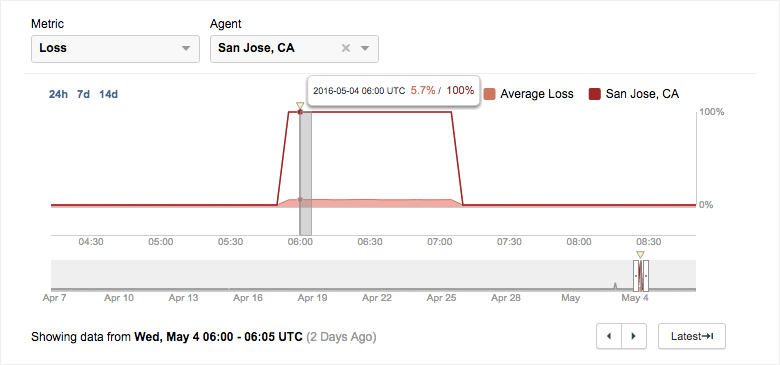
Across many of our tests, including one to a Salesforce endpoint in London, we saw the same pattern of network issues: 100% packet loss from one or two locations, usually San Jose, London or Newark.

and Newark observed 100% packet loss from 10:55pm to 12:05am Pacific.
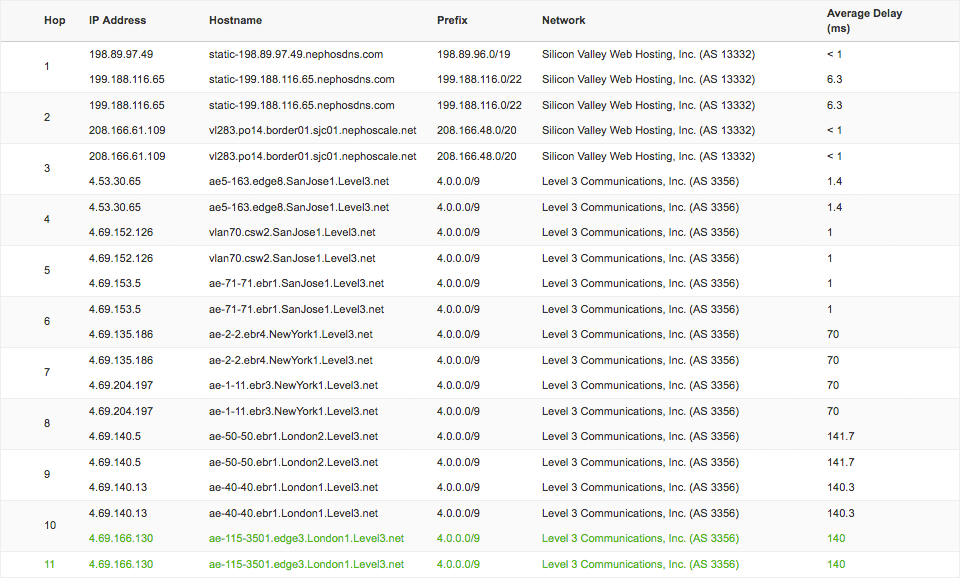
Looking at the path visualization during the outage, we see that the path trace from the San Jose agent terminated in a Level 3 node with IP address 4.53.30.65 in San Jose. Of the 35 ThousandEyes tests that ran through this particular interface, 100% were affected.

So what’s going on at this interface? Is it a localized issue at this one node, or is there an issue with a link? To find out, we examined what the path visualization looked like before and after the outage.
As it turns out, the path both before and after the outage is the same path that was taken during — the path didn’t change at all. The path taken before the outage is shown below, and the first five nodes consistent with the path taken during the outage are highlighted in blue. We see that the next expected hop (after the lossy San Jose node) was in London, also in the Level 3 network at IP address 4.69.166.130.

was in London, also in the Level 3 network at IP address 4.69.166.130.
Interestingly, we saw the same issues mirrored on the other side of the pond — a test to a Samsung site in the U.S. from the London Cloud Agent also observed 100% packet loss in a Level 3 node in London during the same time period, also affecting 100% of 16 tests flowing through that interface. The path visualization from before the event shows that the next expected hop was in Newark, at IP 4.69.156.11 in Level 3’s network.

the next expected hop before the outage was in Newark, at IP 4.69.156.11 in Level 3’s network.
Judging from these tests, it’s likely that there was an issue with a link between the U.S. and the U.K. Let’s try to further narrow down the location of the issue.
Finding Common Circuits
Judging by the common time, duration and characteristics across all of the affected tests, it’s clear that the root cause should also be common among them. We need to look at what common ground these tests have — what common interfaces or links do they traverse?
Going back to the Salesforce test, we know that something went wrong in the hop between San Jose and London. But it’s unlikely that going from California to Europe is really just one hop, so to see if there were any hops between, we performed an instant test from the San Jose agent to the London IP, the next expected hop.
It turns out that there’s an invisible MPLS tunnel from San Jose to London, as we suspected. By targeting an IP internal to the MPLS tunnel, traffic travels via IP routing rather than MPLS. So traffic from the San Jose agent enters the Level 3 network in San Jose, traveling through New York before going on to London.

If we replicate the hops in the Samsung test in a similar way, going from the London agent to the lossy node in Newark, we see traffic traveling from London to New York and then on to Newark through the Level 3 network.
These two tests, along with most of the other affected tests we looked at, sent traffic along a common circuit from New York to London. Most likely, there was a configuration error or failure in one of the interfaces or links between New York and London.
Collateral Damage and Routing around Level 3 Issues
We also came across a few affected tests with traffic that didn’t travel over trans-Atlantic links at all. What likely happened was that as the link between New York and London experienced severe issues, locations that frequently sent traffic over these links became congested and unable to effectively handle all traffic, not just trans-Atlantic traffic.
One example is a test to one of Cisco’s sites with a destination in Cambridge, MA, where a Boston agent saw 100% packet loss on an interface in Boston in the Level 3 network. Looking at the path visualization from before when issues started, we see that the next expected hop is in Newark, at precisely the same IP (4.69.156.11) that we had also expected in the Samsung test.

the next expected hop is in Newark, at the same IP we had also expected in the Samsung test.
However, the service’s operators were proactive and acted quickly in response to the packet loss issues by routing around the Level 3 network entirely. The issues stopped when the path changed, where traffic was no longer routed through Level 3 but through NTT instead. As a result, packet loss issues were observed for only the first 18 minutes of the 70-minute Level 3 outage. The changed path, with unchanged nodes highlighted in blue, is shown below.

Problems in Level 3’s Trans-Atlantic Link
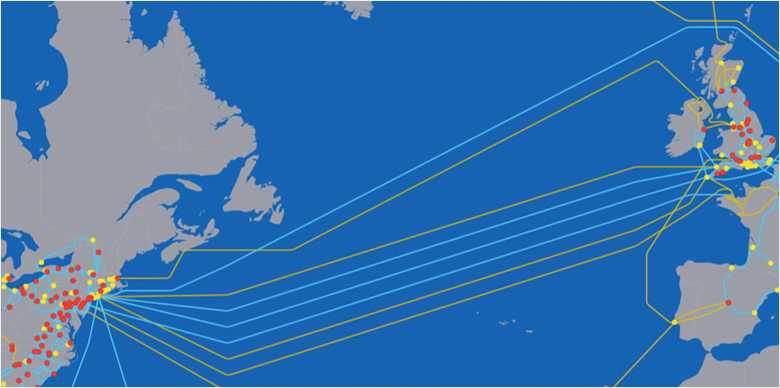
After investigating common issues and paths across a wide range of affected tests, at this point we can conclude that there was likely a configuration error or failure in one of the interfaces or links on one or several of Level 3’s trans-Atlantic paths between New York and London.

one or several of Level 3’s trans-Atlantic paths between New York and London, shown above.
We also saw that some services’ operators proactively addressed the packet loss issues by routing traffic through a backup Internet service provider instead of Level 3. Equipped with the right tools, you too can start taking on problems in your network head on. You can run all of the above analyses, including Path Visualizations and Instant Tests, with a free trial of ThousandEyes.