How can network monitoring help understand online trading website performance? In the first days of February, 2018 the stock market went on a bit of wild ride, with high levels of volatility amidst heavy trading sessions. On February 5th, the Dow skidded almost 1600 points before recovering slightly to a loss of 1175 points for the day — its worst daily point drop ever.
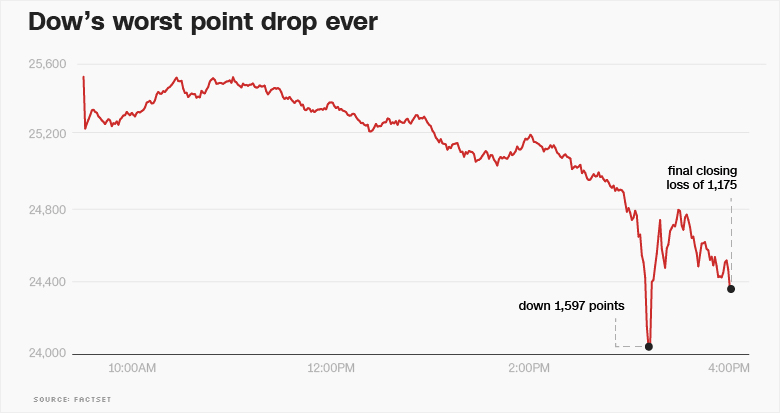
Asian markets soon experienced their own swoon. Then on February 6, U.S. markets bounced back — regaining nearly 570 points, while the FTSE experienced its biggest drop since Brexit. As of February 9, the volatility continued.
During this period of volatility, a number of online trading websites reported outages or slowdowns. That’s not surprising given the market conditions, but it’s still not a great outcome for online customers. So, if you’re responsible for such a trading website it’s helpful to know how your customer experience is going and what underlying factors are a playing a part in performance problems.
Typically, network monitoring data collection focuses on fairly siloed domains, such as device status and per-link traffic volume and composition. These data silos make it difficult to derive helpful insights into anything but pure network problems. Furthermore, most passive network monitoring data, like flow or packet capture, is only available from network infrastructure you own and operate. When you’re dealing with either Internet-facing digital business websites or Internet-dependent cloud app usage, you simply can’t get that data — since your ISP, CDN, DNS and SaaS providers won’t let you collect data from their infrastructure. Network Intelligence — a modern update to traditional network monitoring, lets you see both what the user experience is for a site and why. Network Intelligence can do this because it collects multiple types of Internet-aware network performance monitoring data with application and service performance data from many vantage points, and correlates them in an algorithmic fashion.
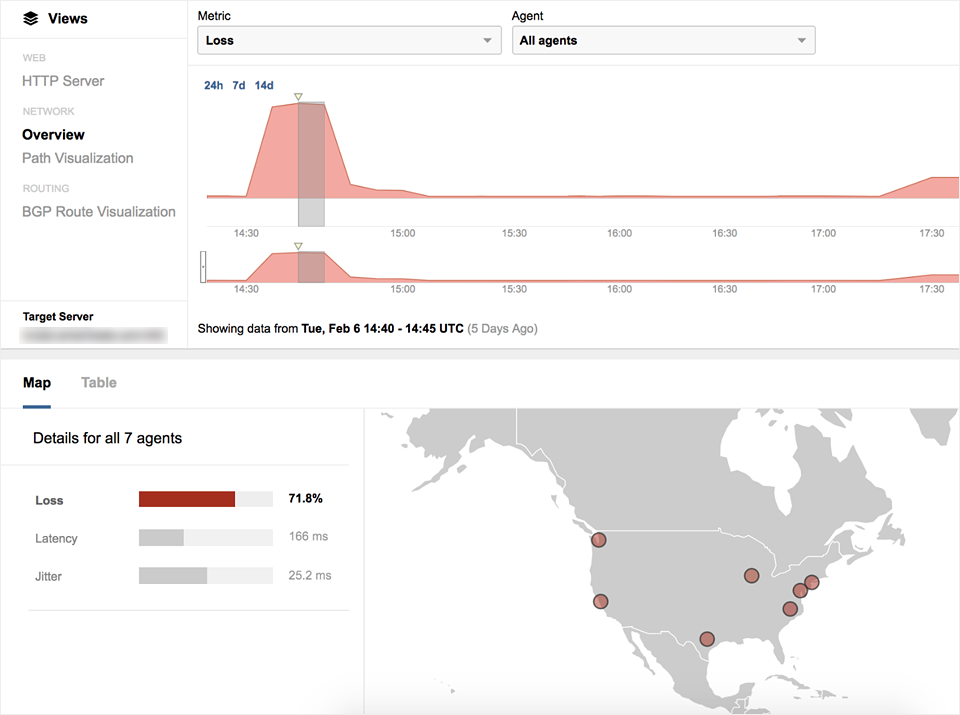
Using this more penetrating level of visibility, let’s take a look at how one major online trading site was behaving on the morning of Tuesday, February 6th — the day after the big drop in the Dow. At 16:30 UTC or 9:30am eastern time — the start of trading hours, this online trading website starting experiencing serious drops in HTTP availability for over an hour, as seen in Figure 2:

We can see that the pain is being experienced from multiple cities in the United States in the map view below:
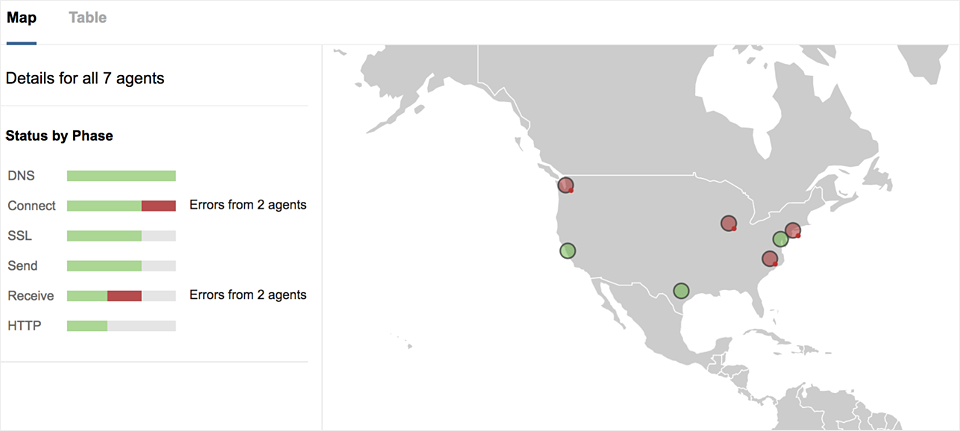
But what’s interesting is that in the legend on to the left of the map view above, we can see that there are two types of errors being detected by our network monitoring agents. Receive errors indicate that no answer is being received back from the website, which we can correlate to the infrastructure in the datacenter being overwhelmed. This isn’t surprising given the unusual market circumstance and the heavy opening trading hour. But the Connect errors typically indicate a network issue. What’s causing those Connect errors? If we look at the network layer metrics in the graph below, we start to get a clue. Every monitoring agent is experiencing packet loss — to the tune of nearly 72% loss overall.
If we then switch to look at the network paths, we can see that there are multiple routed hops in the network paths to the site’s hosting data center that are having issues.
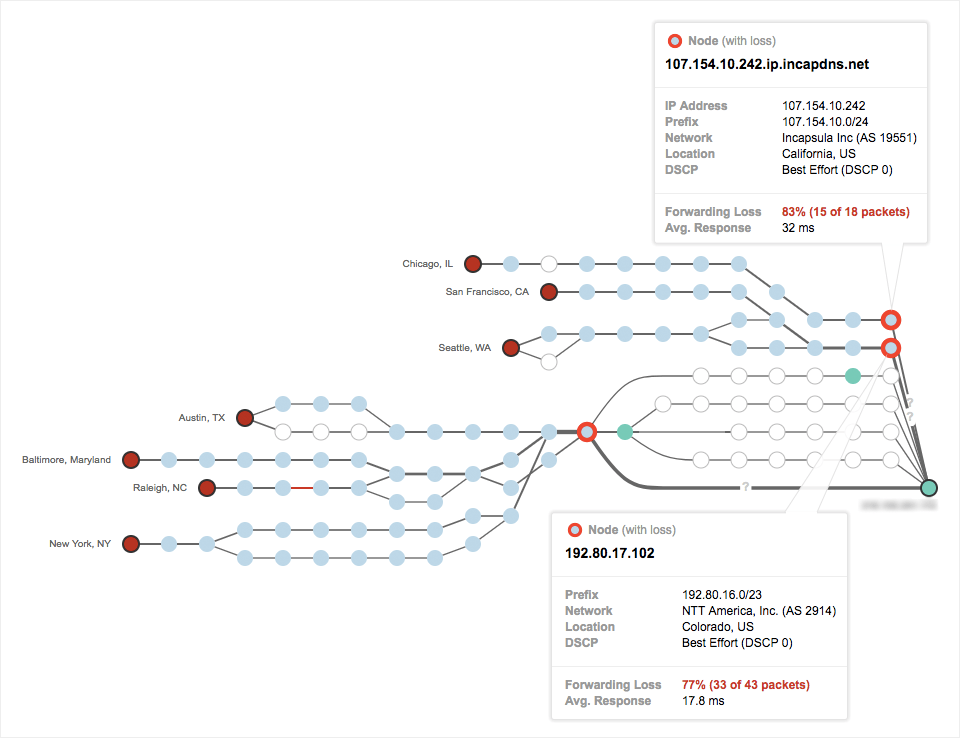
and increased packet loss within NTT & Incapsula's network.
It so turns out that these nodes belong to two service providers — NTT America and Incapsula, both of which are showing very high levels of packet loss.
What could explain this level of packet loss? One possible explanation is that on top of the high volume of online traders trying to connect to the site, an attacker launched a DDoS attack which congested the site’s provider edge until DDoS detection and mitigation mechanisms kicked in and started dropping the attack traffic. Alternatively, it’s also possible that legitimate users were all of a sudden launching so many simultaneous online sessions that the volumetrics looked like an attack and legitimate user traffic was initially dropped by the service providers until a new traffic baseline was established. Either way, in effect there was a denial of service event.
As a point of comparison, we looked at the same timeframe for another online trading site and saw significant drops in HTTP availability due mostly to receive errors, but no issues with the Connect phase, as seen below.
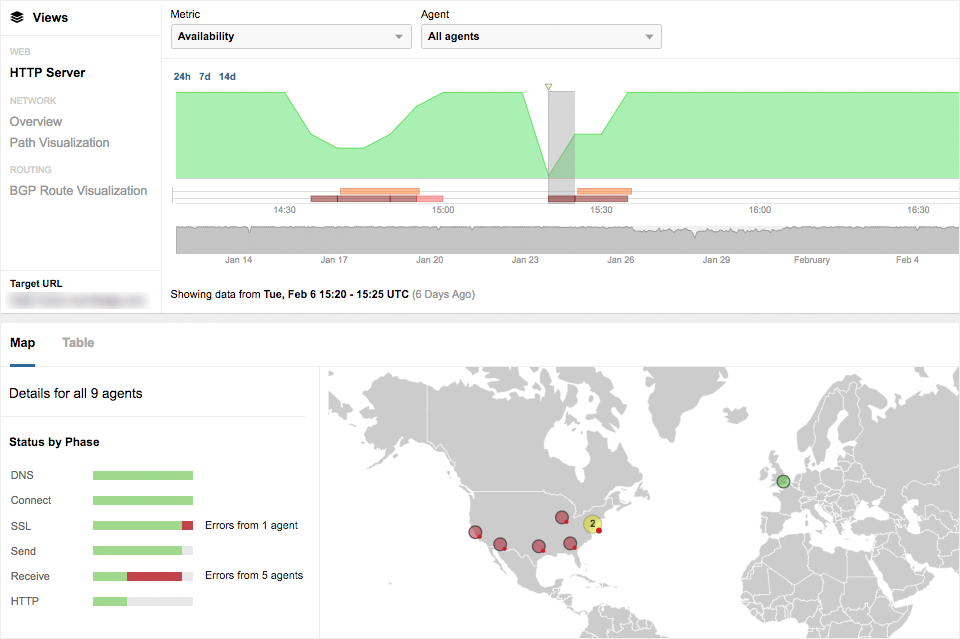
The service providers differed in this case, but both trading sites were experiencing very high volumes of user login attempts at the beginning of trading so the denial of service event in the first case is noteworthy, whatever its precise cause, and would be worth inquiring about with those service providers. Of course, you wouldn’t know to inquire if you don’t have this sort of combined app and network-layer visibility. It may be time to update your network monitoring to gain visibility into Internet paths and provider dependencies. If you’re ready to learn more, request a demo of Network Intelligence. If you’re ready to try this out for yourself, start a free trial.