At ThousandEyes, we’re on a mission to increase your visibility into the network. However, sometimes the network experiences issues when you’re not looking. That’s where alerting comes in! Our purpose-built alerting system is the ever-vigilant watchers on the walls, ensuring you’re made aware of anomalies as soon as they happen. On the surface, all you need to do is instruct our platform on what kinds of situations to look for in your monitoring data (for example, if your network experiences latency or your application availability drops below a certain threshold) and how we should notify you if such situations are detected. Underneath the surface though, there’s a lot that goes on to ensure this process works reliably and efficiently, at internet-scale. In this blog post, we’ll provide a high-level overview of how this process works, along with the basic concepts that the alerting system is built around.
The Basics
The entire ThousandEyes alerting system revolves around the notion of an alert rule. You can think of a rule as a simple, stand-alone program. It expects a certain kind of input (monitoring information), runs some basic logic (alert conditions) and produces an expected output (alerting situation detected or not.) [Figure 1]

You can create these rules from scratch using our handy alert rule creation wizard [Figure 2] by selecting from a wide range of available metrics, or you can opt to use our recommended, default alert rules.
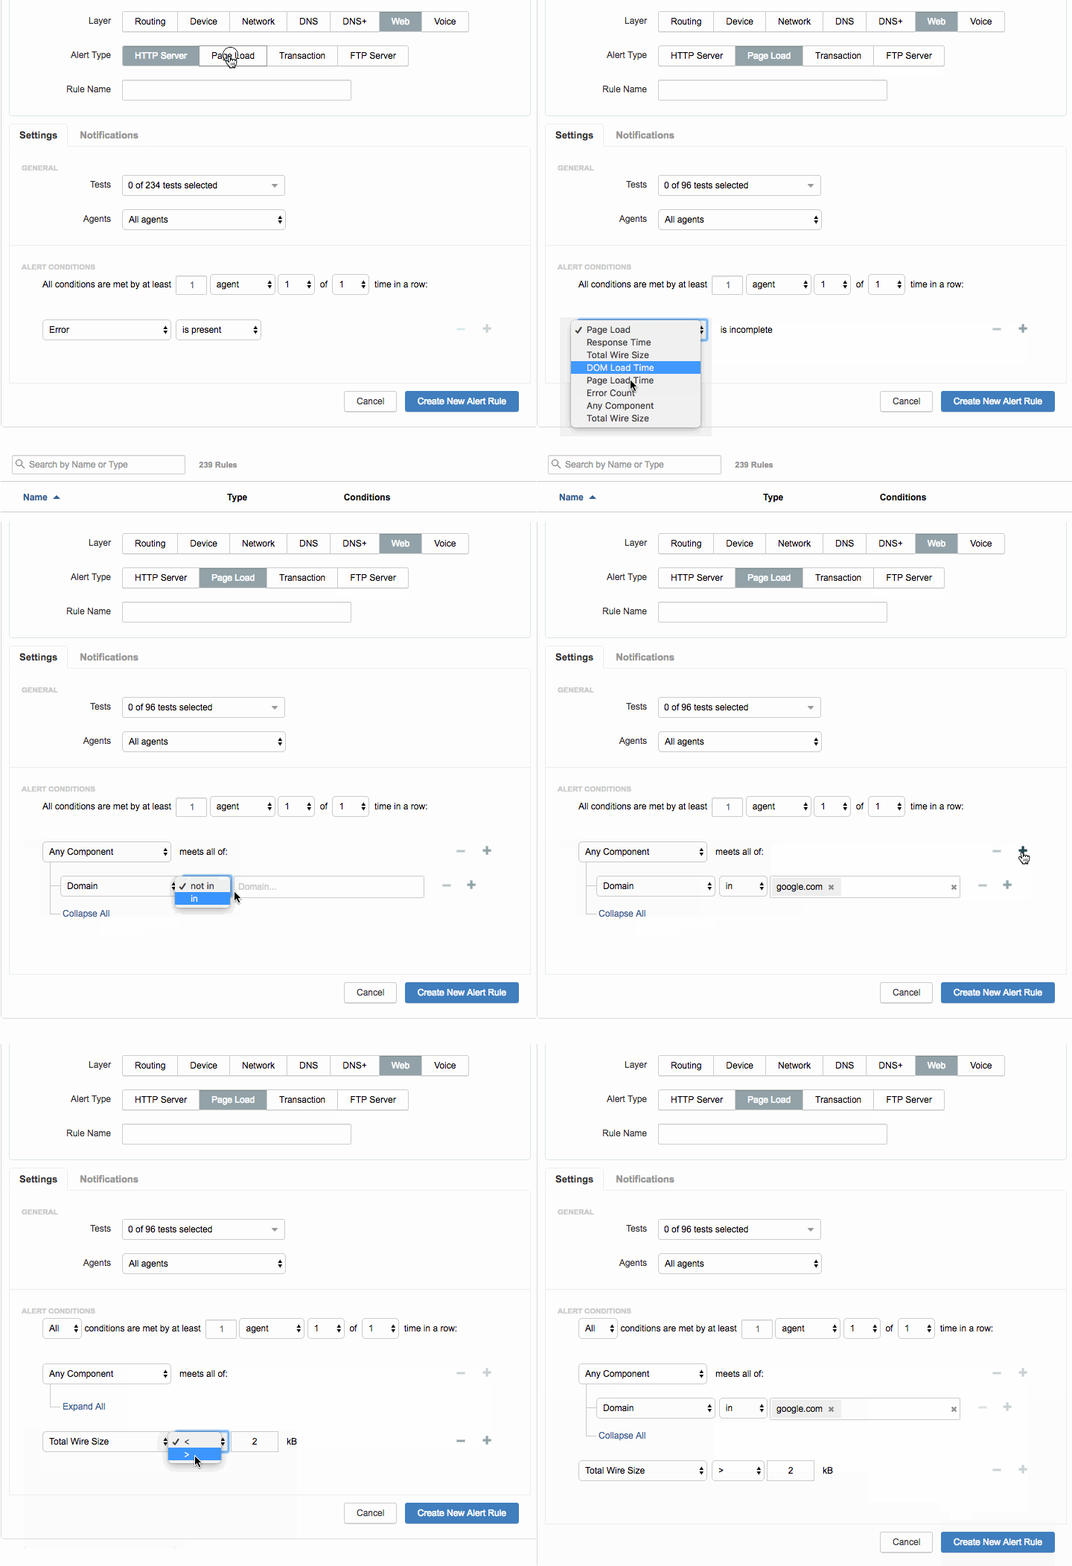
When a new rule is created and saved, it is converted from the form contents seen above, to an internally-developed alert expression language, which is persisted in our database for future reference. This language (known as the ThousandEyes Alert DSL) is its own real, context-free language – complete with parsing, translation, and more. It encapsulates all the logic of the alert rule, allowing the system to cleanly represent what monitoring information should be evaluated and how. This DSL is key to controlling the potential complexity of all possible alert rules users could create and automatically ensures that each rule is valid, given the data that the alert rule is intended to be evaluated against.
The Data
Our digital experience and monitoring data comes from our global collection of deployed agents, which streams into the alerting system via predefined Kafka message queues. These queues are constantly populated with millions of bite-sized chunks of data, we call data points. Data points represent the state of your monitoring target at a single point in time, and are the context for our rules – however, before they can be evaluated against any rules, they need to be refined and put in order. Data enrichment services fill the data points with additional information that may be relevant (i.e. DNS information, etc.) while, reordering services ensure that all data points for a test (which can be assigned to many agents) have been received for a given point in time. This data cleanup is an essential step to ensure that the evaluation and resulting alerts are as accurate & representative of the ground-truth as possible.
Let’s Get to Work!
Now that we have some data, and some alert rules defined, it’s time for the alerting system to get to work! Formally, this is known as the evaluation phase, and the basic process can be broken down into just a few key steps [Figure 3.]
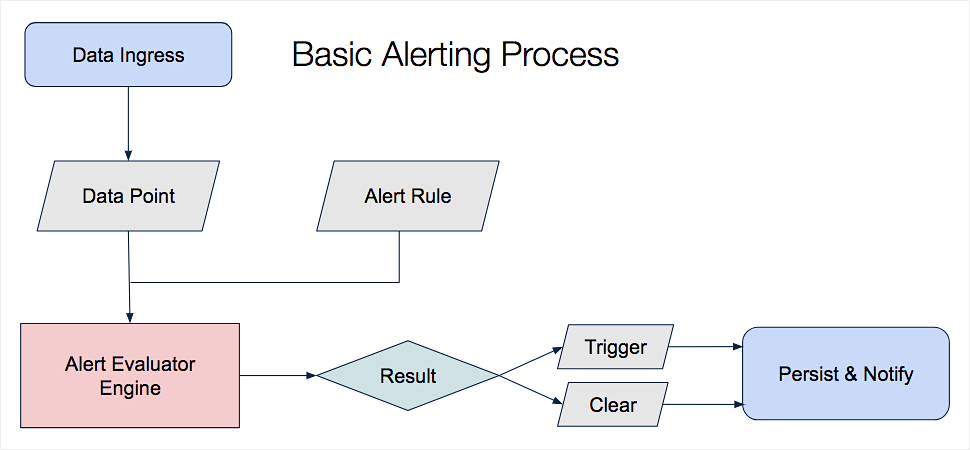
Upon consuming a data point from Kafka, the system determines what alert rules (if any) are applicable – If a rule is found to be relevant, the data point and rule are bound together, and individually sent into the alert evaluator engine. This engine converts the aforementioned alert DSL expression into highly-performant java bytecode, which is then executed against the data point. All of this information is then reduced to a single, unambiguous result: Trigger or Clear. Trigger means that the conditions expressed in the rule were met, and vice versa for Clear. These results tell the alerting system, at the most basic level, what actions it may want to consider taking next, if any. This entire process takes less than a 100th of a second and is performed millions of times per hour.
Taking Action
Given an alert evaluation result – along with metadata associated with the alert’s data used for evaluation – the alerting system then determines if a new notification needs to be scheduled for sending, and how the alert evaluation result data should be persisted. Often times, the determination on whether to send a notification depends on multiple rounds (i.e. points in time where a data point was collected) of alert evaluation results, so the system may store multiple rounds in-memory, to be used for future alert actuation invocations. If the system is satisfied that the detected situation is worth telling you about, it will create a new active alert in the platform [Figure 4], and a new notification schedule event will be persisted into Redis, which will be read later on by the notification service. This active alert will remain active until the system no longer detects the situation (i.e. a Clear evaluation result is seen.)

Sending Notifications
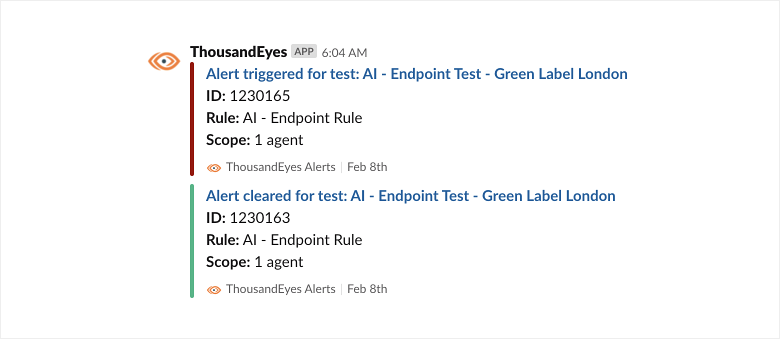
At a high-level, this service listens for Redis change-events to see if new notification schedule events have been created, and if so invokes a set of new notification dispatch jobs. This process reads the associated notification information (persisted by the alerting system) and given the type of integration (e.g. Slack [Figure 5]) associated with the alert rule, executes the external delivery of notification payloads. Retry logic is a key part of this service, as this stage of the alerting pipeline interfaces with external 3rd-party services, whose availability is not guaranteed. If a service becomes unavailable for an extended period of time, the notification system may decide to archive the notification, in order to avoid notifying you of very outdated content.
The Map Is Not The Territory
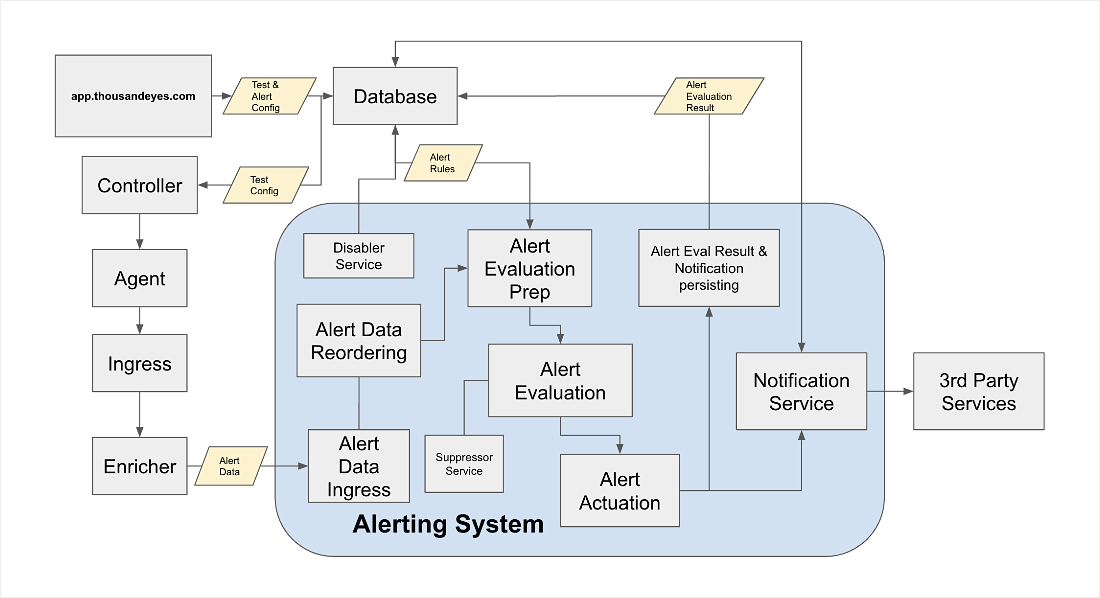
The overview provided so far captures the essence of the alerting process. However, in actuality, there are many additional considerations that must be accounted for in order for this system to work smoothly. The process diagram below [Figure 6] shows in greater granularity some of the other components that are required for the system to operate, which we’ll look to cover in more detail, in a follow-up post.
Technologies
We utilize a wide array of open-source tools and technologies in order to build and maintain the alerting system. For example, the primary alerting business logic is written in Java in various Spring Boot applications, which communicate using Protobuf messages via Kafka. CUP LALR parser is used to define the ThousandEyes Alert DSL and parser implementation. Like so many others in the industry, we owe a lot to the open-source community, which is why we’re happy to give back & open-source our own solutions.
Conclusion
Alerting is a core competency of the ThousandEyes platform, and today the system described above successfully processes tens of thousands of data points per second, resulting in thousands of notifications delivered each day. We’ll look to dive deeper into the technical implementation of this system, and some of the challenges we tackled along the way, in a future post. In the meantime, if working on these kinds of systems sounds up your alley, please check out our Engineering careers page and apply today!