As explained in our recent blog post, The DDoS Attack on Dyn’s DNS Infrastructure, a large-scale DDoS attack took down a good chunk of the Internet on the morning of Friday, October 21st. It was a very busy morning for anyone involved with website reliability and network operations in any of the hundreds of businesses that were, in one way or another, impacted by the outage. Several SaaS and web services vendors proactively reached out to their customer base, maintaining transparency and informing their users that the situation was beyond their control.
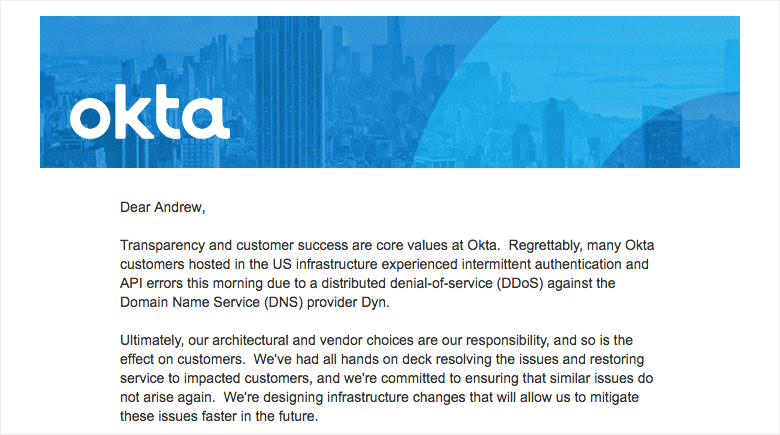
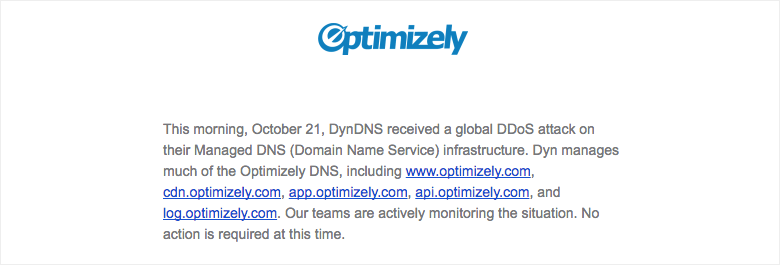
Over the last several years, we have all observed an increase in ‘as a Service’ providers, and with that, businesses end up relying on other businesses to run a wide range of critical components, services and processes. Having a constant view of the performance of any web application/service/script, yours and third parties’, is essential to ensuring business continuity.
Spotting and Correlating Patterns
Not surprisingly, we eat our own dog food. We use our own product to monitor our web properties. In the Marketing team, we constantly keep an eye on our Corporate Website and Blog, as well as third-party scripts that we rely on for some web components
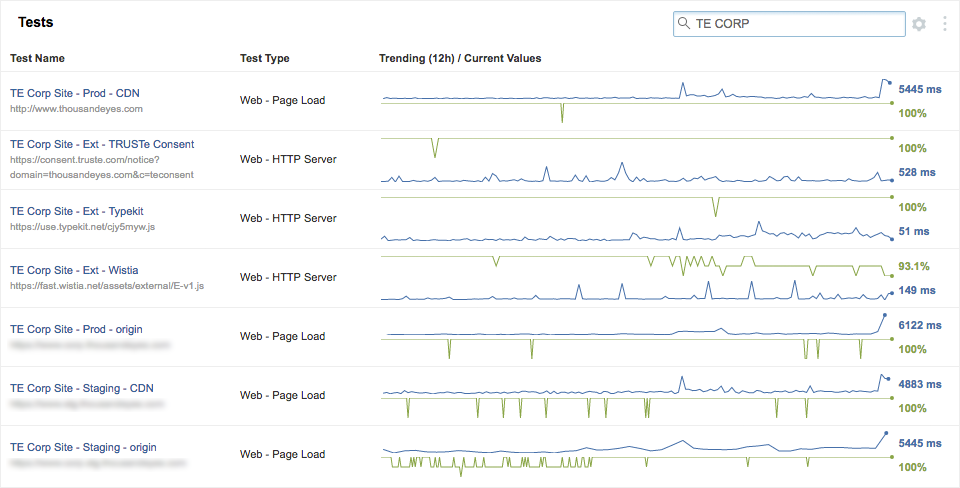
On the morning of Friday, October 21st, we noticed a significant increase in page load times for our web properties and, during the same time period, we also noticed a decrease in availability for some of the third-party scripts. After reading several reports, we knew there was a connection.
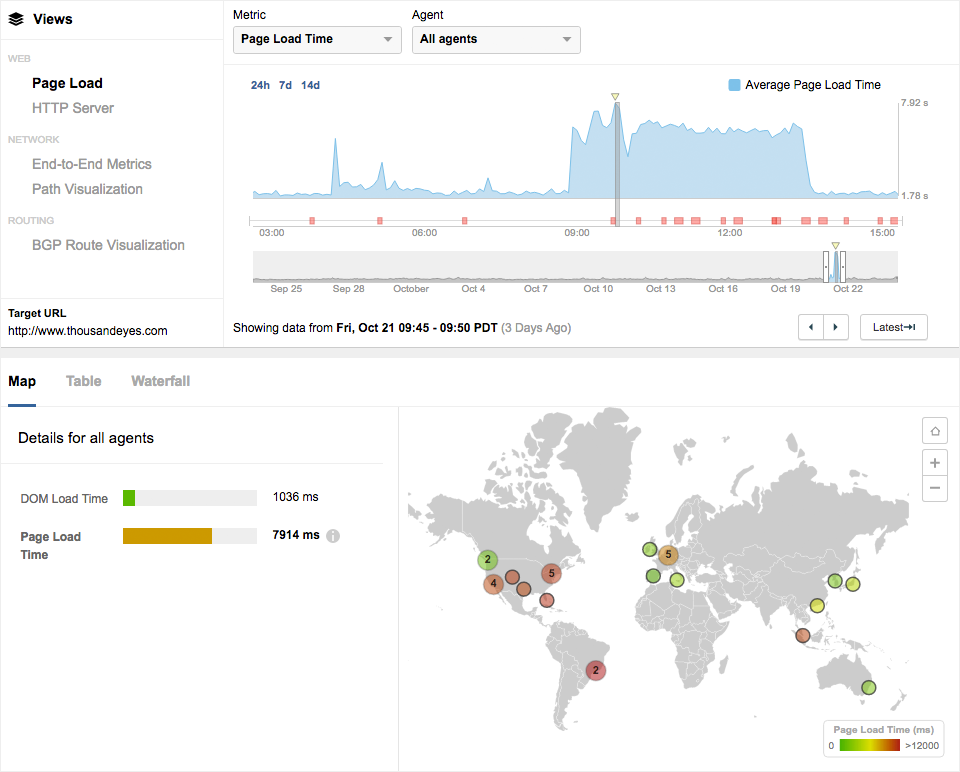
In the process of finding the root cause of this issue, the first step was to correlate across views to establish an initial hypothesis. At a glance the page load view showed a significant increase in Average Page Load Times, peaking at around 8000ms, where the normal baseline levels are consistently under 2000ms. This is essentially a 400% increase, which is a very bad sign.
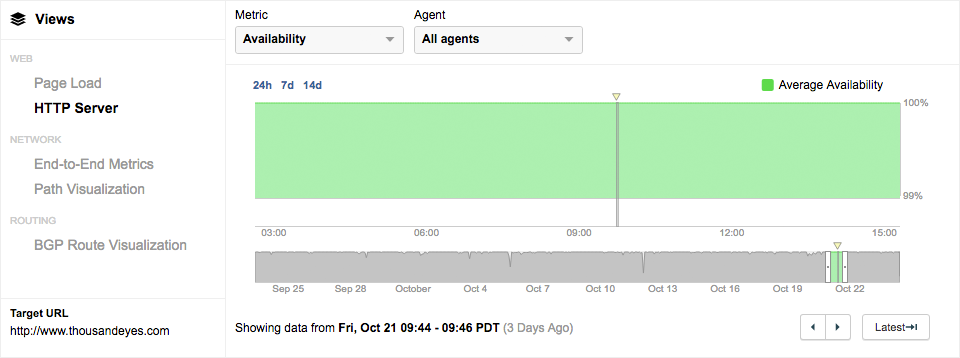
To further inspect this moment in time, we look at the HTTP Server view for the same time interval. The Average Availability graph shows a steady 100% with no interruptions. This means that a visitor is able to fetch a response from the target URL, but for some reason that response is taking a very long time to load.
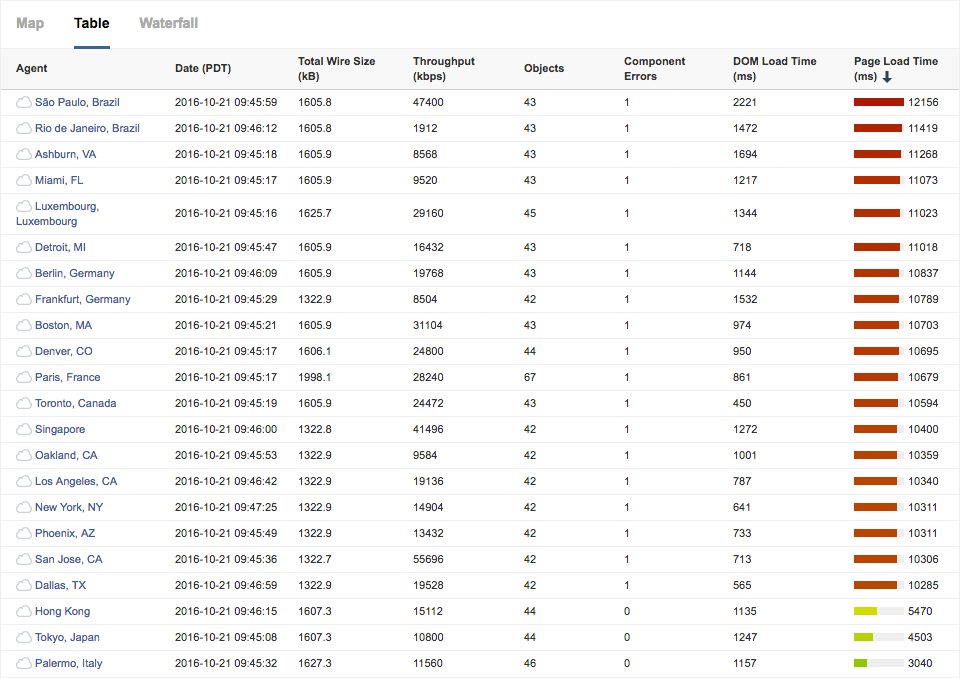
Knowing that there are no issues with availability, we take a deeper look at the the Page Load view. The map in Figure 2 showed several locations being affected. Looking at that data in more detail on a table view, we can see several locations were reporting a very high Page Load time paired with 1 Component Error.
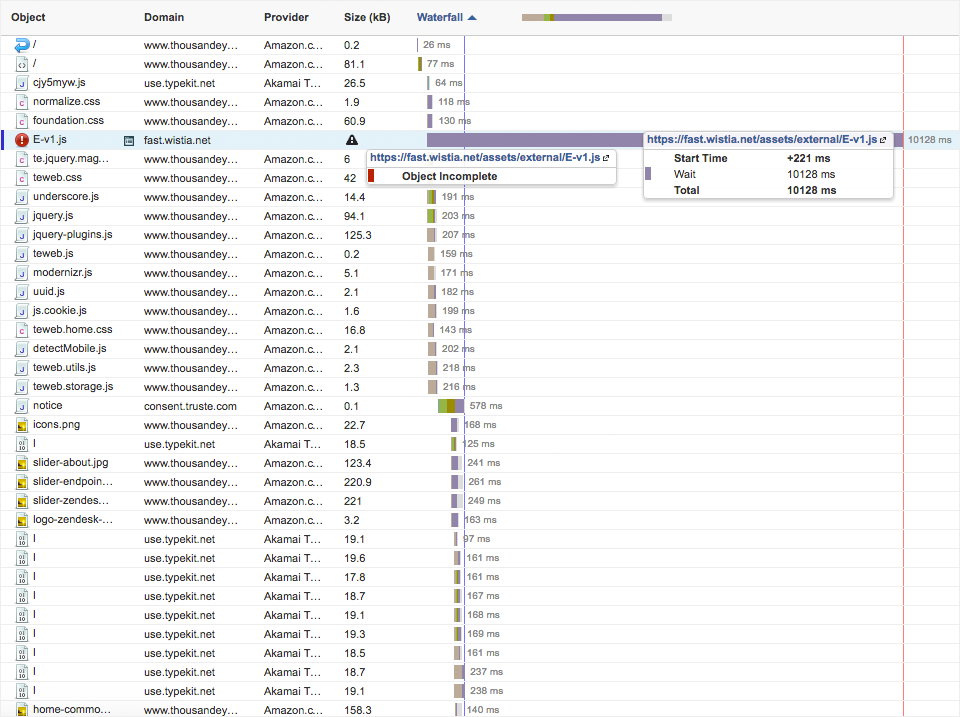
In order to figure out what is causing the Component Errors being reported for several of these locations, we look at Oakland, CA specifically to dive deeper into the Page Load waterfall.
Third-Party Dependencies
In the waterfalls for several of the locations showing increased page load times, the entry for Wistia’s 'E-v1.js' script was consistently marked as "Object Incomplete" with a significantly large wait time. This likely meant that the destination was unreachable.
In earlier events where third parties were affected by large outages, we learned the importance of monitoring the performance of third-party web components as well, so luckily we had already set up tests targeting some of these external scripts we rely on.
A few hours before the DDoS began, the normal conditions for the Wistia script showed that the provider for the 'fast.wistia.net' domain is Fastly.
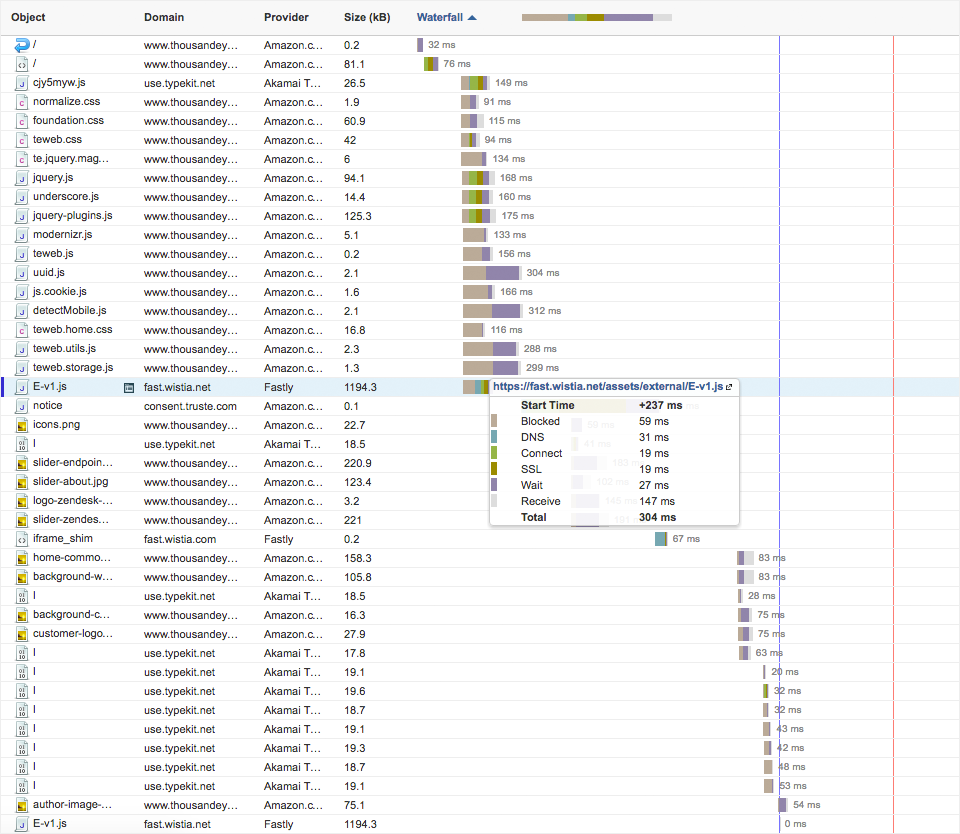
And with this last piece of data, we reached the ‘aha moment’. If Fastly is a Dyn customer, then that would explain the issues. Although Dyn is not a direct third party that we interact with, they are a provider that we indirectly rely on through other third parties. See how things can get messy?
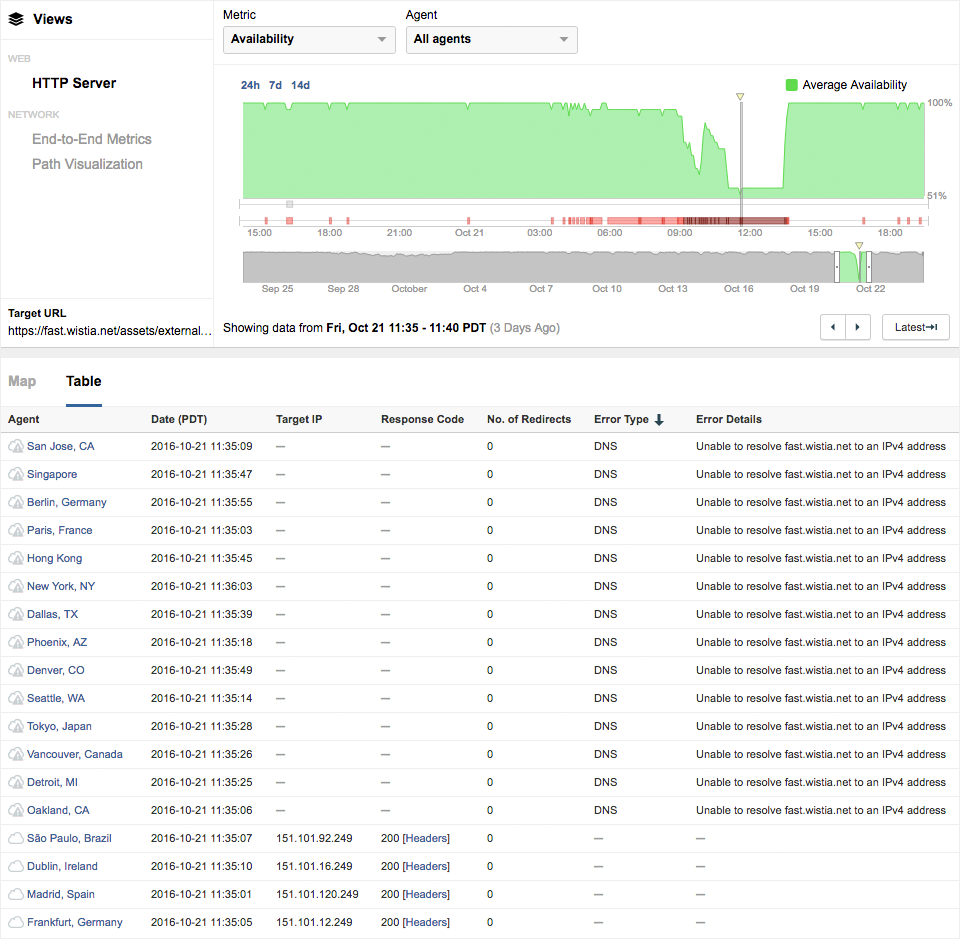
During the worst part of the outage, we spotted a dip in availability to around 55% with several DNS errors reported for the Wistia script.
Conclusion
We were able to conclude that the increased page load times observed in the ThousandEyes corporate website were caused by Wistia's script being unreachable, which was being served by Fastly, which in turn, was a customer of Dyn, relying on them for managed DNS. If our only tools were pings, traceroutes and wireshark, it would be nearly impossible to reach this conclusion.
The fact that businesses and service providers can have nested dependencies with other businesses and providers, can lead to a lot of confusion when trying to find the root cause of the problem in situations like these. In some cases, it might also lead to single points of failure, if certain providers become too much of an anchor within your systems architecture.
Although our critical business operations weren't severely affected by this recent outage specifically, there's no guarantee that this would be the case if this were a different third party. Moral of the story, it’s very important to monitor performance of critical third-party scripts and services that your business may rely on.