Over the past two weeks, Facebook has had three notable and major outages — on Monday Sept. 28th, Thursday Sept. 24th and Thursday Sept 17th. Facebook is a relatively stable service with high availability; the last major outage was back in February. It’s also a service that impacts many others. The outages affected Facebook-owned properties, such as Instagram. The outages also affected third-party applications and websites in a variety of industries, from retail to gaming and entertainment. As web services get larger and more integral to both consumers’ lives and to businesses’ operations, understanding these outages has become of critical importance.
So three major Facebook outages in two weeks is a surprising turn of events. Yet no root cause analysis reports have been issued. What’s going on? How do these events compare? We found that each of the three events appears to be caused by different factors. The latest, major event was caused by an application failure. Last Thursday’s outage appears to be a network issue. And the previous week’s outage was a short, partial outage that was not possible to narrow down a root cause.
Let’s jump into the data and see how we reached these conclusions.
Sept. 28th Outage: App Failures
The most recent and most severe outage occurred on Monday Sept. 28th. It lasted for approximately 100 minutes, from 12:00pm to 1:40pm PDT. It affected users worldwide and for 40 minutes resulted in a complete outage from all 18 of our selected monitoring points, as seen in Figure 1. For the few users that could connect, page load times were well exceeding 10 seconds in many cases.
If you’re more hands on, you can follow along with the interactive data set https://eonwecui.share.thousandeyes.com as we walk through the analysis.
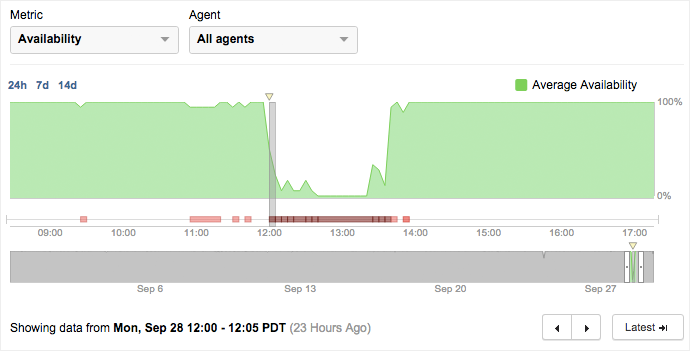
So what caused this huge outage? There are indications that this was an application failure and not a network failure.
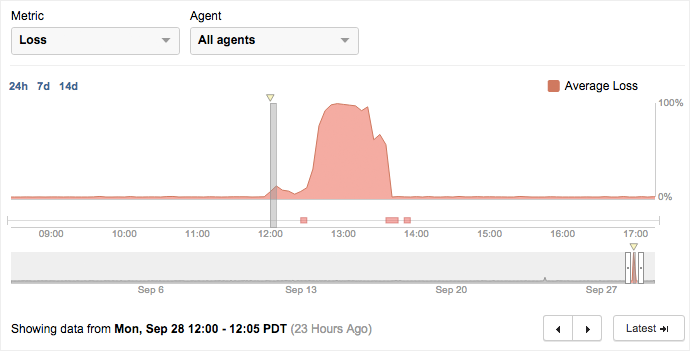
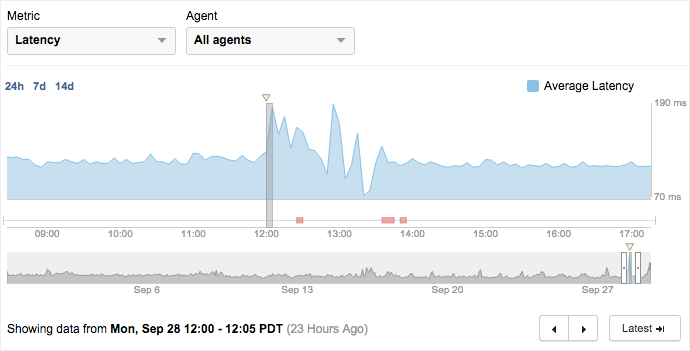
Network loss and latency were elevated slightly at the beginning of the outage, but did not reach critical levels until 12:35pm, 35 minutes into the event. Since application layer issues happen first, we can reasonably assume that indications of failures in the Graph API or some of its dependencies was a trigger.
You can see in Figures 2 and 3 that network loss was over 90% for nearly 40 minutes and latency was highly variable. From 12:45pm to 1:20pm, almost no traffic was reaching Facebook’s destination servers.
There are two potential explanations here: either a cascade of traffic occurred to overwhelm the system as the outage unfolded, or, more likely, Facebook intentionally terminated traffic at the data center edges. In Figure 4, we can see traffic terminating from a selection of our agents within the Facebook network. Termination occurs across Prineville, Altoona, Ashburn and Forest City data centers, suggesting a network wide configuration change. And it occurs within similar Juniper designated routers (DR), that we can identify from reverse DNS.
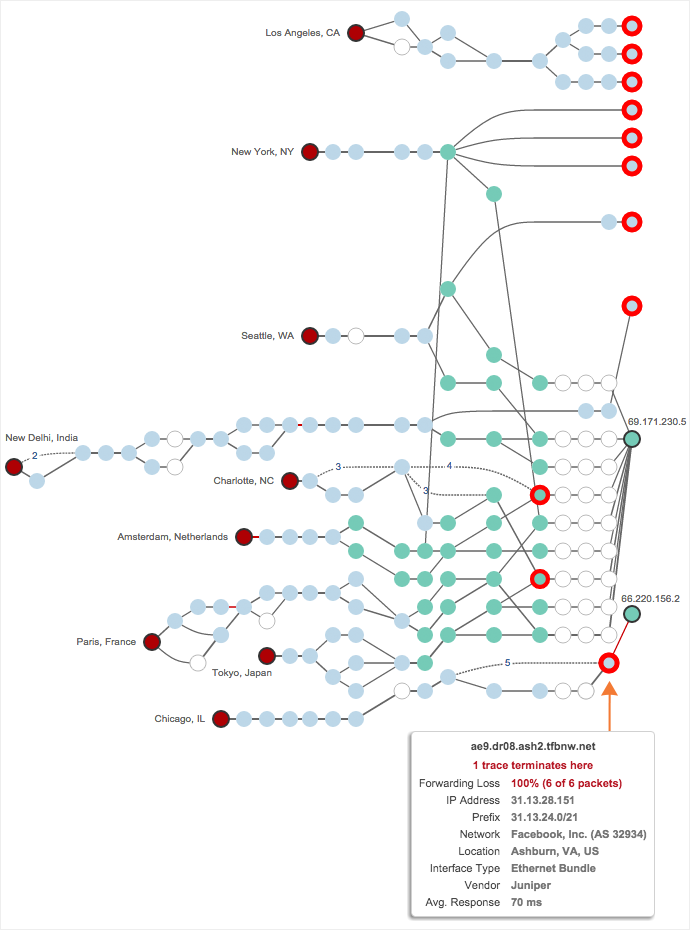
In addition, information about other affected services, such as Instagram, which experienced availability issues (see https://qfmui.share.thousandeyes.com), but is hosted in completely separate infrastructure, indicates that an application failure was at work across Facebook’s core application services.
Application issues preceding network loss, problems across all data centers and common points of path termination would seem to indicate an application or global configuration issue rather than a network or data center infrastructure problem.
Sept. 24th Outage: Network Failures
Last week, on Thursday Sept. 24th, Facebook had another outage that lasted between 10 and 15 minutes, from 9:30am to 9:45am PDT. This resulted in immediate, global loss of connectivity to Facebook and all of its data centers.
Follow along with the interactive data set for Thursday’s outage https://iqejakgl.share.thousandeyes.com as we walk through the analysis.
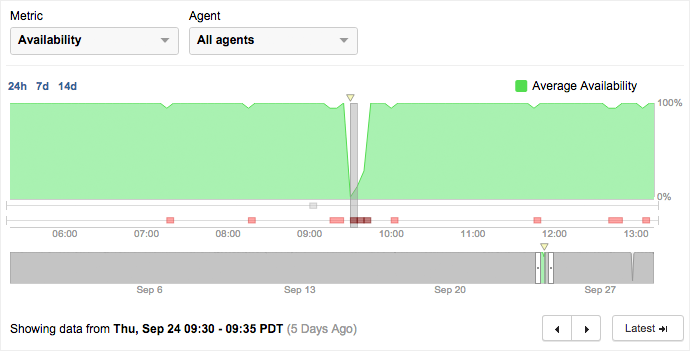
Figure 5 highlights the loss of availability and Figure 6 shows the extent of the issue. It’s global, affecting users from around the world, and manifests itself as a TCP connection failure, as you can see in the HTTP errors.
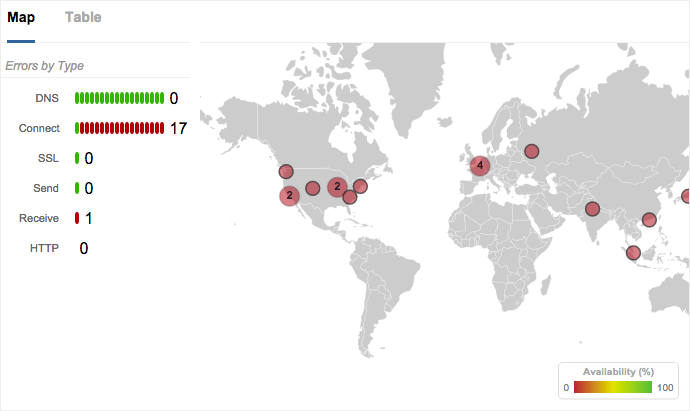
These TCP connection errors look directly correlated to Figure 7, where we can see packet loss increasingly dramatically for the period of 5 minutes. Packet loss in excess of 80%, as observed, would make any application nearly unusable.
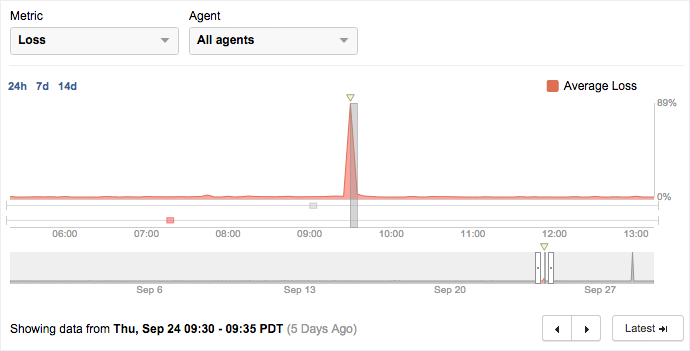
Packet loss can be caused by a number of factors, but in the case of a network-wide outage it usually indicates a control plane issue (either internal or external routing) or changes to ACLs (intentionally or not) to block traffic. Since we did not see any changes with BGP, the routing protocol that defines traffic routes into the Facebook network, and all loss occurred within Facebook’s data centers, we can reasonably assume that some sort of internal network error or configuration change was most likely involved in this short but impactful outage.
Sept. 17th Outage: Inconclusive
The September 17th was another short, approximately 10 minute outage, from 11:00am to 11:10am PDT. You can follow along with the interactive data for the Sept. 17th event https://vroyqvnbn.share.thousandeyes.com as well.
This outage appeared to be caused by issues in the HTTP receive phase, as data is transmitted back to users. This compares to a variety of errors in the first outage analyzed and TCP connection errors in the second event. In addition, the outage only affected some locations, rather than from all of our selected monitoring points. Connect, SSL and Wait times all were elevated, indicating issues with the Facebook application or dependent services. Figures 8 and 9 show the availability and errors.
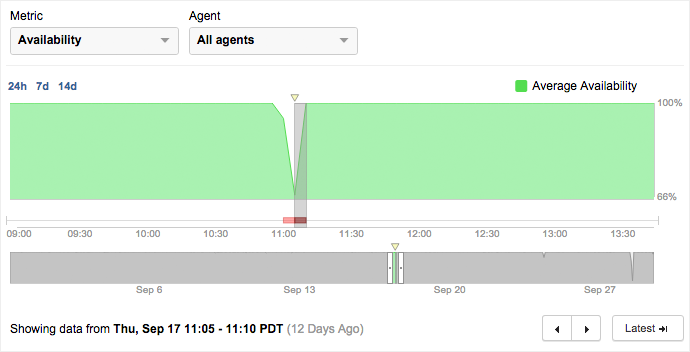
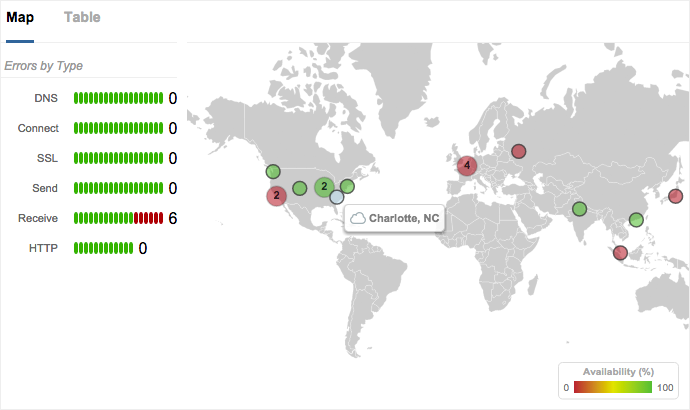
This event is the hardest to determine a probable cause. Potential issues could be a network issue with egress traffic, causing receive errors or an application issue that affected the ability of Facebook’s web servers to respond. Given the number of data points for this event, we cannot reasonably say what exactly happened.
Comparing Outages
As we observed, these three outages each appear to have different root causes. Some stem from the application layer and others from the network layer. There are a number of key data points to consider if you’re attempting this sort of troubleshooting on your own application or one that you depend on:
- Page load timing and objects can indicate third party issues
- HTTP errors can give hints to whether it’s a problem with your app or network, though in catastrophic outages nearly every stage can fail, regardless of root cause
- Geographic correlation and target IP address grouping can indicate data center affinity
- Path tracing to understand loss and latency in transit, core or data center networks
- Routing information to rule out route leaks or misconfigurations
Having insight into each of these layers: page load performance, HTTP errors and timing, path tracing and routing information is critical to understanding these types of outages. But in this case we’ve demonstrated that even without access to any internal network or application knowledge, we can make reasonable inferences that can be combined with observations from other monitoring products or alerting systems.
Interested in getting insights like this for apps you rely on? Or ones that you maintain? You can run all of the analyses above, and even check out the Facebook data set, by signing up for a free trial of ThousandEyes.