Content delivery networks have become a crucial part of getting applications and media to users around the world. They can provide lower latency, load balancing, lower bandwidth costs and higher availability. Nearly a third of the largest websites are primarily hosted in a CDN, with many more containing CDN-hosted content.
Over the last few months I’ve been hearing more and more stories from our customers about how they use ThousandEyes to better understand their CDN deployments. They are troubleshooting global CDN deployments, planning new rollouts and monitoring complex, multi-CDN operations. At ThousandEyes Connect in May, eBay shared how they plan and optimize their CDN performance and Twitter spoke about their experience serving up content around the world using a several CDNs. Here are some insights into how some of the heaviest users of CDNs are doing their monitoring.
Why You Should Monitor Your CDN
You pay your CDN to deliver great service to your users. If you’re in a large web or media firm, you may be spending millions of dollars annually on your CDN. So you probably care about your CDN’s performance. Here are a couple of reasons to keep tabs on your CDN with ongoing monitoring:
- Prove value: Benchmark services, pages or objects before and after it is CDN enabled. Or run ongoing tests both to your edge and origin to compare performance.
- Optimization: Ensure your CDN is directing users to the best edge location and is optimizing the cache to reduce misses and retain freshness.
- Troubleshooting: Have forensic tools at your disposal to identify CDN outages, determine which edge is serving your requests, find performance issues between the user and the edge, and dig into caching errors.
Methods to Monitor Your CDN
There are quite a few ways in which you can monitor your CDN. Many folks will already have an APM or RUM solution in place, which helps to understand overall performance, but can be sorely lacking when you’re trying to troubleshoot network issues. Why is there higher latency to a specific edge location? Why did the edge location change suddenly?
We’ll focus here on how you can use active probing to monitor CDN performance, with broad global visibility and deep insight into specific network issues that cause performance to fluctuate. You can take several broad approaches to actively monitor your CDN:
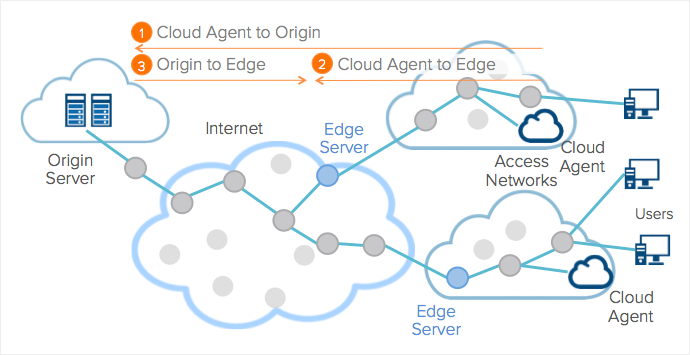
- User to Edge: Monitor the edge to see locations, network performance and cache utilization. Use Cloud Agents distributed in customer geographies to target a domain, page or specific object.
- User to Origin: Monitor the origin to create a baseline of performance without your CDN, traversing the public Internet. Again, use Cloud Agents.
- Origin to Edge: Monitor the connection between origin and edge to ensure proper routing and bandwidth for content updates and cache misses. Use Enterprise Agents to target the CDN edge; depending on your CDN configuration you may want to target specific, proximate edge locations or intermediate load balancers.
To start monitoring, set up a Page Load Test to see overall performance of all objects on the page. The HTTP Server and Network Tests that come bundled with the Page Load Test will be directed to the root page, which may be CDN-hosted or which you may host in a data center. To monitor your CDN-based objects, set up an HTTP Server test for each of the CDN-hosted domains.
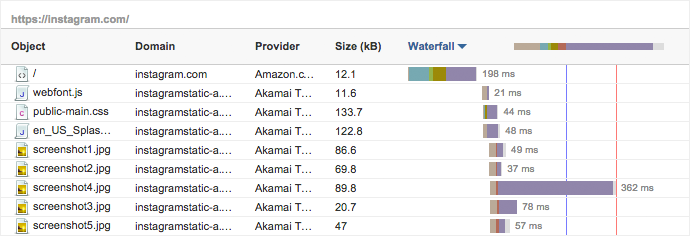
Figure 2 shows an example for Instagram. A Page Load Test to instagram.com will monitor the network connection to AWS, where the Instagram root file is hosted. An additional HTTP Server test to instagramstatic-a.akamaihd.net would monitor the Akamai-hosted images and files.
What to Metrics Monitor
Edge Locations: The first step is to ensure that your CDN is serving user requests when you expect it and serving them from rational edge locations. You probably don’t want users in Latin America being served from an edge location in Europe. Each CDN uses different techniques, including GSLB (Incapsula), DNS (Akamai mapping) and Anycast (Cloudflare) as well as performance data to route requests to their edge. If you use multiple CDNs, for example in different geographic regions, you’ll want to ensure this is all set up properly.
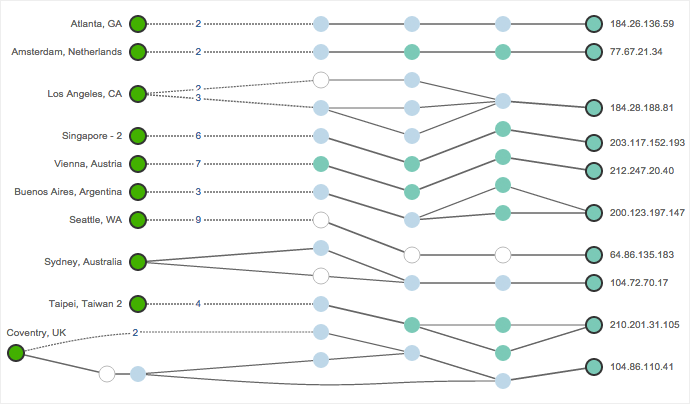
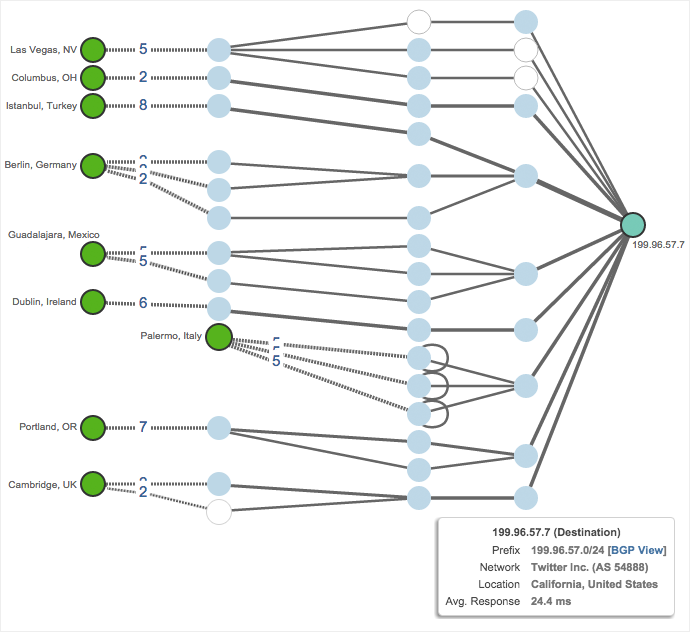
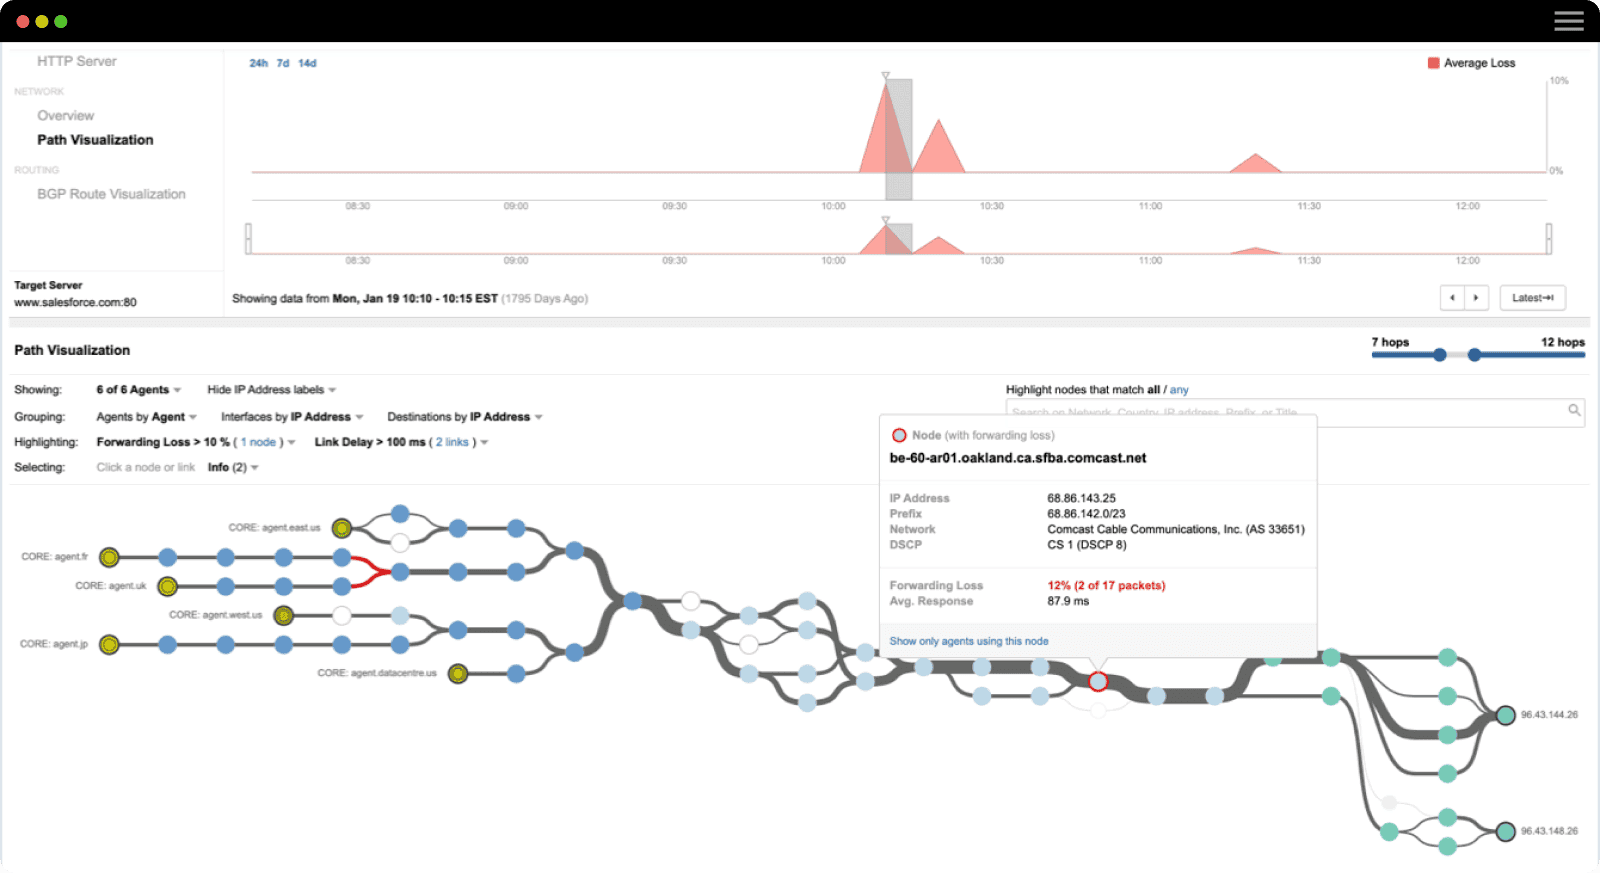
In ThousandEyes, you can use Network Tests to see paths from cities around the world to your CDN edge. Each round of measurements will start with a fresh DNS query, which your CDN will route to the appropriate edge. You can verify edge locations in the Path Visualization, DNS queries with DNS Tests or you can set up geographic-based alerts to match the user geography to the expected edge location and CDN provider.
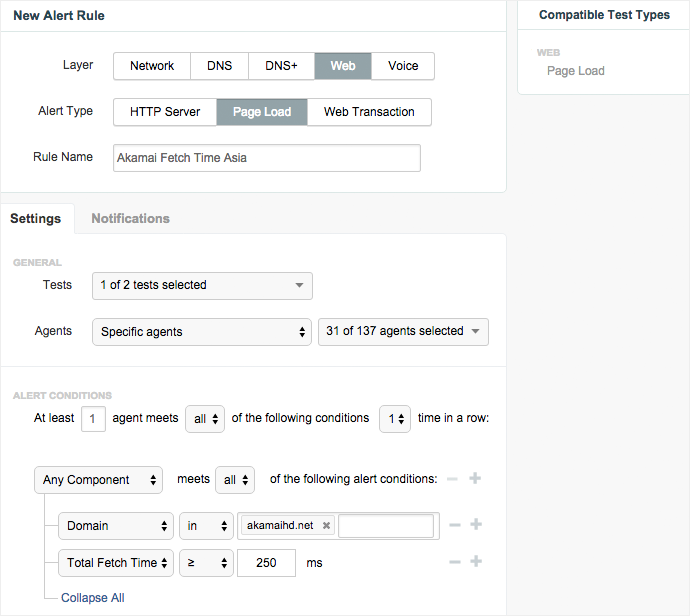
Response Time and Latency: A second key metric is response time, which can be be broken down into constituent parts such as DNS lookup time, connection time and wait time. All of these should be low and stable if your CDN is operating properly. Across edge locations and geographies you’ll want to ensure that connection time and underlying latency is within an expected range, as it is most likely to vary when their are network issues. You can easily set up geographic-based alerts for latency, response time or connection time. ThousandEyes also measures bandwidth and capacity as well, if you have large objects that require a fat pipe between your users and edge or origin and edge.
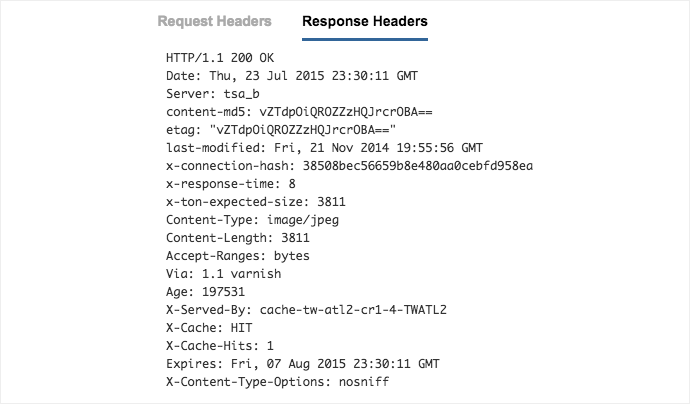
Individual Objects: Rather than poor CDN performance overall, it may just be one object that is causing issues. This could be caused by a bad caching configuration (such as compression) or server-side issues at the edge. Use the Page Load waterfall to detect problems and component-specific alerts to keep your notified of issues. Use HTTP headers to confirm which the status of your request as well as the relevant server.
So you’ve got some great ideas for CDN monitoring. Now what? Sign up for a free trial of ThousandEyes.
