Troubleshooting application and network issues is seldom fun — it’s rarely clear where the root cause of the issue lies, and context-switching between multiple monitoring platforms adds to the confusion. Today, we’re taking a step forward on tackling this problem with our new Device Layer feature, which uses Enterprise Agents to provide additional visibility into network devices within your own internal network.
What’s Device Layer?
Device Layer provides visibility into your internal network devices by gathering network device topology, interface and health metrics. On tests running through your network infrastructure, Device Layer enhances the Path Visualization by correlating device context,with IP forwarding path, routing and application-layer metrics. You get end-to-end visibility into application performance and richer network path metrics in a single pane of glass.
Our Vision
Our vision at ThousandEyes is to provide end-to-end network visibility by applying insights from multiple layers of data to applications delivered across both internal networks and the Internet. We achieve that vision through a combination of active probing and real-time monitoring from distributed vantage points (our Cloud, Enterprise and Endpoint agents).
Our Enterprise Agents monitor the availability and response times of privately hosted and cloud-based applications. Enterprise Agents also correlate application metrics with network performance metrics and provide a hop-by-hop L3 path visualization from the source agent to the target application. Device Layer expands on our vision and provides an additional layer of visibility into network device health so users can even more rapidly spot issues.
Why Use Device Layer?
Traditional device monitoring solutions are siloed, focus solely on monitoring the health of the network device and fail to provide contextual data on how device health could possibly affect application and service delivery performance. Customers have had to rely on additional tools to monitor their Layer 1/2 network infrastructure and match device data with the L3 - L7 insights from ThousandEyes. A common theme we hear from our customers has been the need for a single monitoring dashboard that proactively alerts on application and network issues before they turn into downtime.
Device Layer helps solve this problem, unifying insights from the application and network layers all the way down to network devices. With Device Layer, you can troubleshoot issues and diagnose root cause in a single pane, ultimately decreasing MTTR and ensuring a great application experience for your users.
Apart from troubleshooting issues like interface congestion, faulty ports and line cards, Device Layer also tremendously helps traffic engineering decisions by providing end-to-end visibility from the application all the way to the physical network topology.
Device Layer also helps with housekeeping by tracking the inventory of network devices added to or removed from your network. Use the timeline functionality to go back and forth in time to understand the topology modifications and performance implications of these changes. Monitor multiple branch or data center locations and view them all in a single dashboard.
Device Layer in Action
In the following example, we have a simple branch network with an employee portal web server and a number of clients that are using it. We also have two ThousandEyes Enterprise Agents running a download test that attempts to download a file from the web server and measure throughput and other network metrics in the background. One of the Enterprise Agents has Device Layer enabled and collects interface metrics and device data from the monitored network devices.
The download test is periodically triggering alerts, and we notice that availability drops and latency increases each time. So let's dig in and see if we can figure out why there is trouble accessing the employee portal.
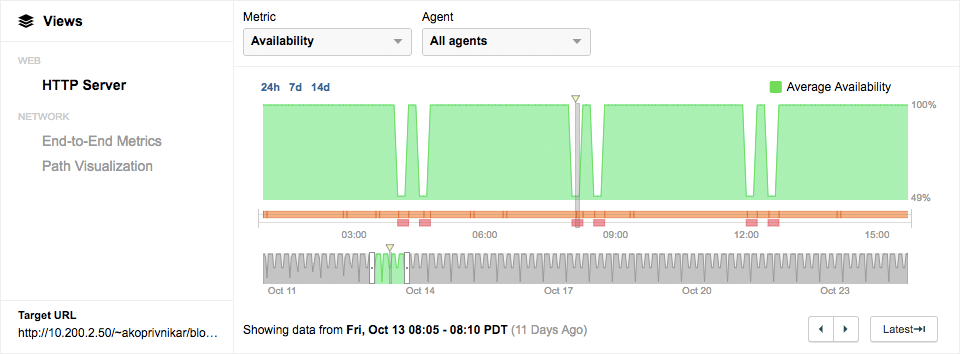
Let's start by taking a look at the HTTP server performance metrics. In Figure 1 below, the HTTP Server view shows a periodic drop in availability — something is wrong with the performance of the server.
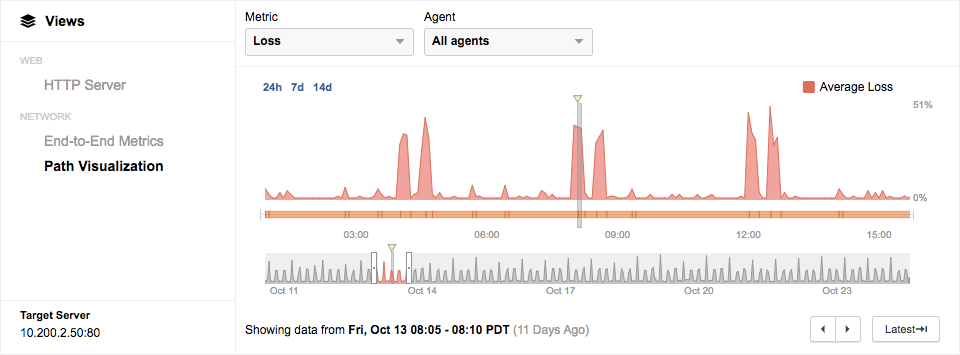
At this point, we still can't be sure if the problem is on the application or the network layer. So let's dive a little deeper in the Network view, as shown in Figure 2. In the End-to-End Metrics timeline, the network quality problem (high loss) directly correlates to the decrease in application availability. This clearly tells us that the problem is on the network layer, but at this point, we still don't know where and why.
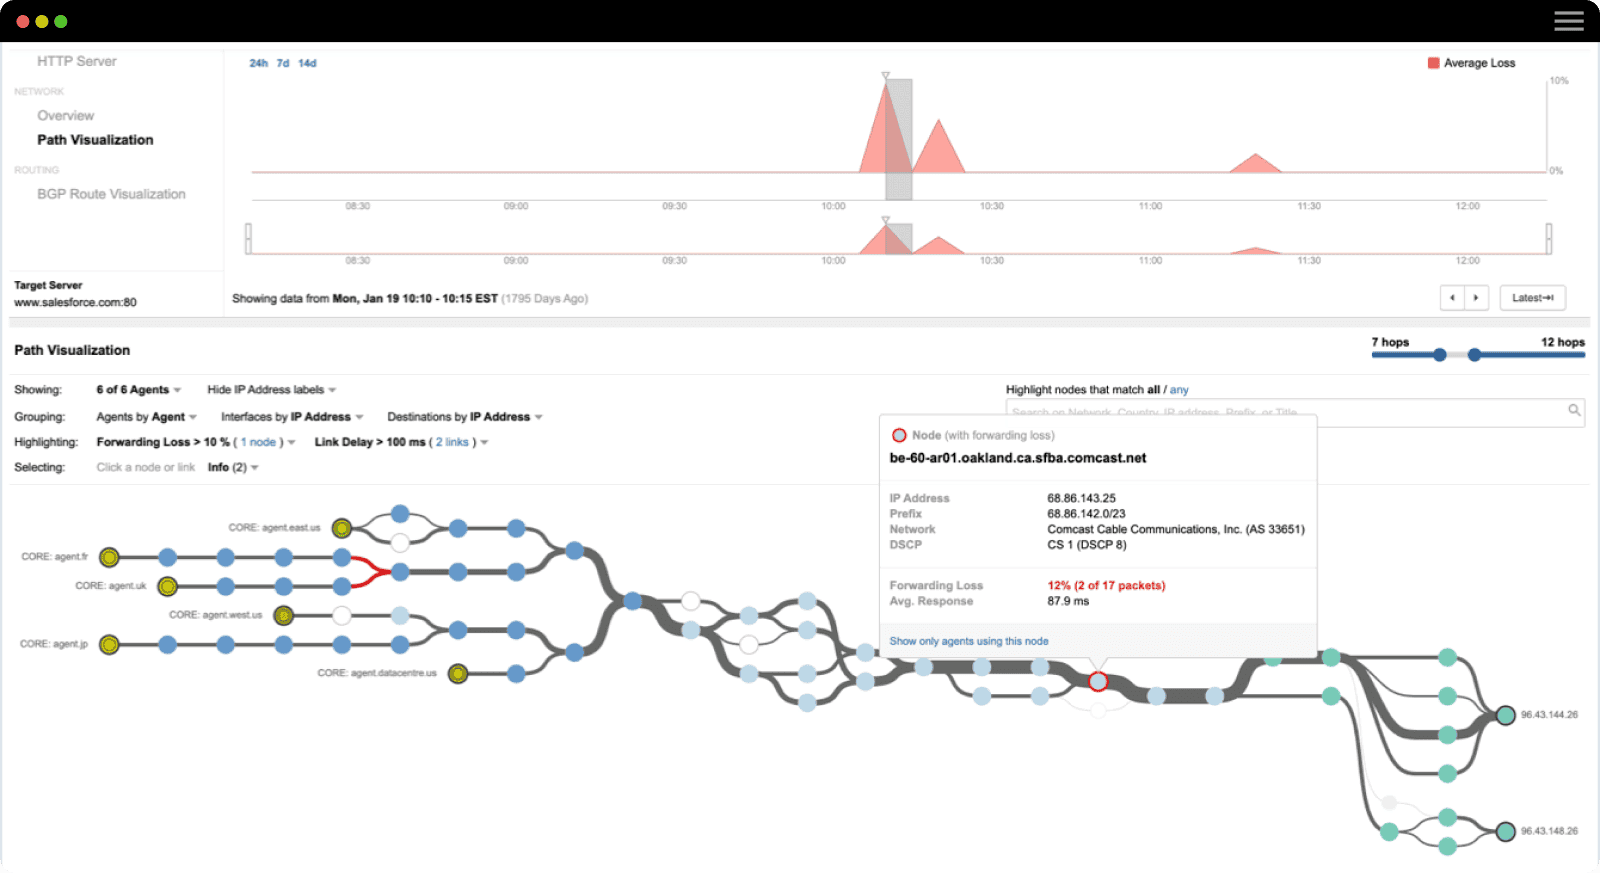
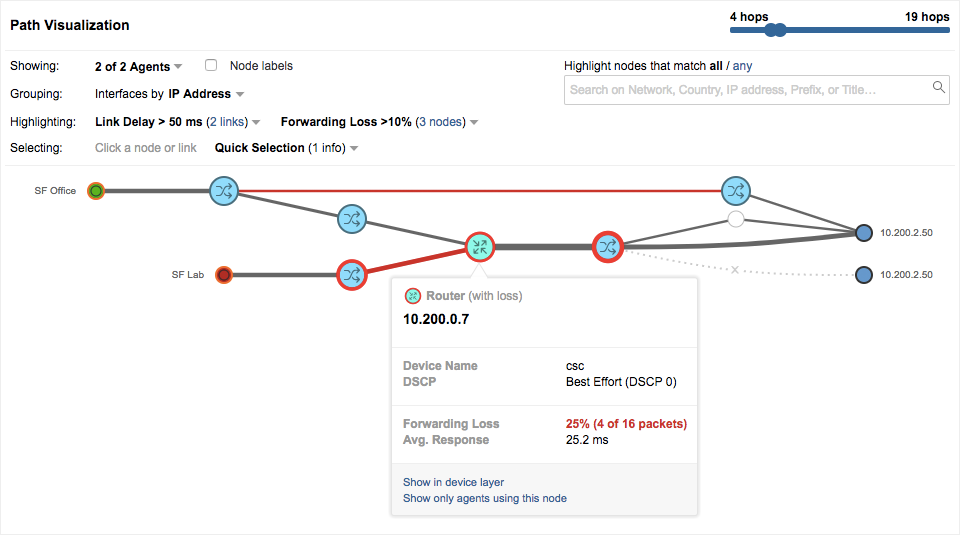
To get more context on the network path traversed by the web portal traffic, let's take a look at Path Visualization. We see that there is forwarding loss on the CSC router to the target server. This is where our analysis would generally end, but with Device Layer enabled we have additional data on these devices.
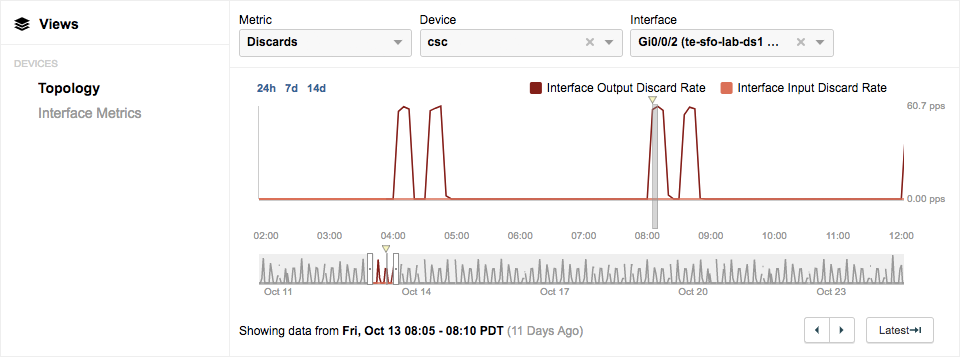
Clicking on the ‘Show in device layer’ link in the CSC router pop-up takes us to the Device Layer view with additional interface and device health metrics for the router in question. From the Device Layer view, we can see that there is a direct correlation between the spike in packet loss in the HTTP Server test and the spike in interface discards on the CSC router.
Additionally, with Device Layer we can see the physical topology and interface parameters of Layer 2 and Layer 3 network devices, beyond the layer 3 devices that we previously saw in the Path Visualization, as seen in Figure 5.
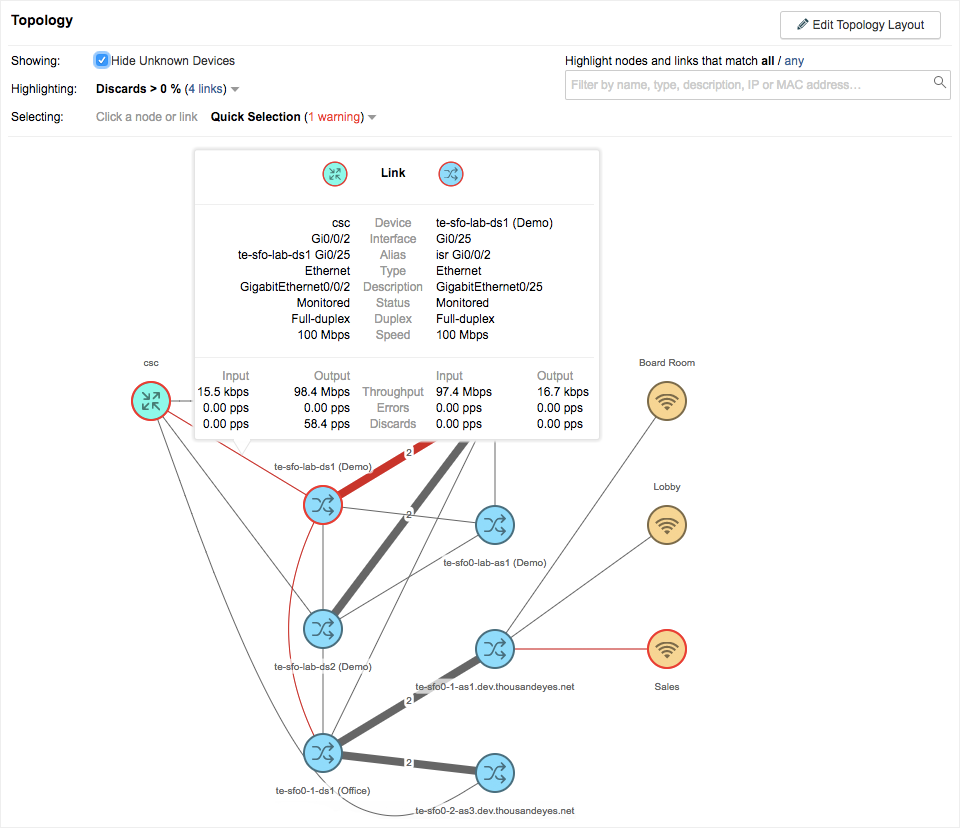
In the above topology, the link between te-sfo-lab-ds1 and CSC router is highlighted in red to indicate that discards are occurring on that link. Hovering over the link provides more insights on the interface parameters. Though the devices are connected through Gigabit interfaces, we see that the link is configured to operate at a 100Mbps speed, and the In/Out Throughput is just a little less than 100Mbps.
To determine if there are other links on the CSC router that are experiencing discards or errors, let's jump into the Diagram tab under the Interface Metrics link.
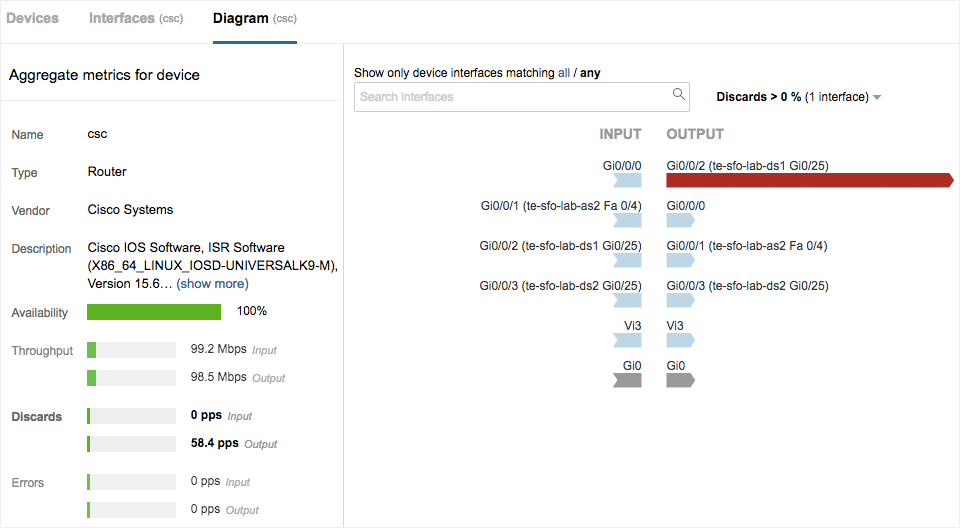
of interface Gi0/0/2 on the CSC Router, there are no other interface errors or discards.
The Diagram view above in Figure 6 shows that other than the discards on the output of interface Gi0/0/2 on the CSC router, there are no other interface issues. The root cause of the periodic network loss and application availability issues in this example appears to be due to interface congestion on Gig 0/0/2 when traffic exceeds the configured speed of 100Mbps.
Under the Hood
Let’s take a look at how Device Layer works: Our Enterprise Agents perform periodic SNMP polling of IETF standard IF-MIB and CDP/LLDP MIB to collect the device metrics and topology information. As a prerequisite, Device Layer requires the monitoring Enterprise Agent to have access to the SNMP management vlan and SNMP RO credentials (either v2c or v3 versions) of the network devices.
Initial configuration is essentially zero-touch, and the device discovery can be automated using scheduled discovery where the monitoring Enterprise Agent periodically scans a target host, IP address or subnet range and discovers network devices to be monitored. Alternatively, the network devices can be added by specifying an IP address or hostname target using a manual discovery process. Users can then choose specific interfaces within the discovered devices to periodically collect health metrics and network device data.
Device Layer currently uses SNMP as a data source as it is arguably still the most widely used standard to gather network device metrics. However, it is built to be open and extensible to support other data collection mechanisms in the future.
