Here at ThousandEyes, we’re big on solving problems. We aim to give people the data and tools they need to quickly identify performance problems with their websites or network assets. One test we offer our customers is an “HTTP Server” test -- we request a URL provided by the client and time each step of the process using cURL. In the “normal” case, when a client is talking directly to a webserver, measuring these values is fairly straightforward. Unfortunately, some clients sit behind proxies and cannot talk directly with the webservers they wish to monitor. While our agents can be configured to work with proxies, measuring performance with HTTP proxies becomes a bit trickier. The goal of this blog post is to explain the differences between direct and proxied communication and how proxies affect timing measurements.
The Anatomy of an HTTP Request
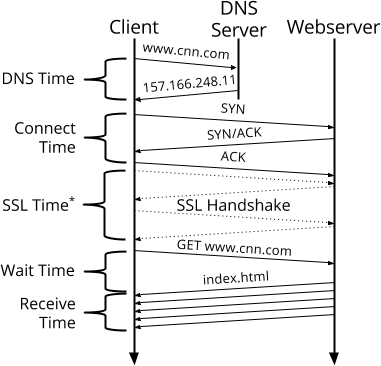
There are five distinct phases that we track when fetching a URL: performing a DNS resolution (DNS time), establishing a TCP connection (connect time), performing an SSL handshake (SSL time), sending the request and waiting for the first bytes of the response (wait time), and receiving the full response (receive time). When one of our agents makes a request directly to a webserver, measuring these values is fairly straightforward. Figure 1 shows a timing diagram of a sample request for www.cnn.com.

DNS time is computed as the time to resolve www.cnn.com to an IP address. Connect time is the time it takes to establish a TCP connection to the IP address returned from the DNS resolution. If the URL is served over HTTPS, then the SSL handshake takes place next. Wait time is computed as the time between when the HTTP request is sent and the first byte of the response is received. Finally, receive time is simply the time between when the first and last bytes are received.
Enter: The Proxy
When a normal HTTP (not HTTPS) request is made through an HTTP proxy, almost all of these steps are affected. Figure 2 shows the communication pattern of a client making a proxied request for www.cnn.com. Now the DNS time is the time to resolve the proxy’s hostname, rather than www.cnn.com. Similarly, the connection time is the time to connect to the proxy server. The next step is for the client to send the HTTP request to the proxy. At this point, the proxy has to resolve www.cnn.com to an IP address, open a connection to this IP address, and forward the client’s HTTP request to the webserver. The proxy then forwards the data back to the client as it receives it.

From the client’s perspective, the original DNS time and connect time have now been swallowed up in the wait time -- it is no longer possible to measure these values independently. Traditionally, an increase in wait time would indicate that a webserver did not have the resources to serve requests quickly enough. Unfortunately, with a proxy it is impossible to distinguish this type of problem from a slow DNS provider or lossy network leading to increased connection times.
Proxying HTTPS Requests
When a client makes an HTTPS request through a proxy, the picture is even more complicated. Figure 3 shows the communication pattern of a proxied request for https://www.bofa.com. DNS and connect times are measured the same way as a proxied HTTP request, but handling the SSL handshake requires special processing. In order to do this, the client first sends a “CONNECT” message to the proxy, indicating to which site it should open a connection. The proxy then does a DNS resolution of www.bofa.com and opens a TCP connection to the resulting IP address. At this point, it sends a message back to the client indicating that a connection has been established. The client now begins the SSL handshake, which is tunneled through the proxy’s open connection to the webserver. The SSL time is measured as the time from when the “CONNECT” message is sent until the SSL handshake is completed. Finally, the client sends its encrypted request over the tunneled connection and the wait and receive times are measured as they are without a proxy. To see all of the gory details of HTTP tunneling, check out RFC 2817.

With a proxied HTTP connection, we saw DNS and connect times disappear into the wait time. However, when making an HTTPS request, these values now become part of the SSL time. In addition, the SSL time will also be inflated due to the additional “CONNECT” and “Connection established” messages sent between the client and the proxy.
Real-world Examples
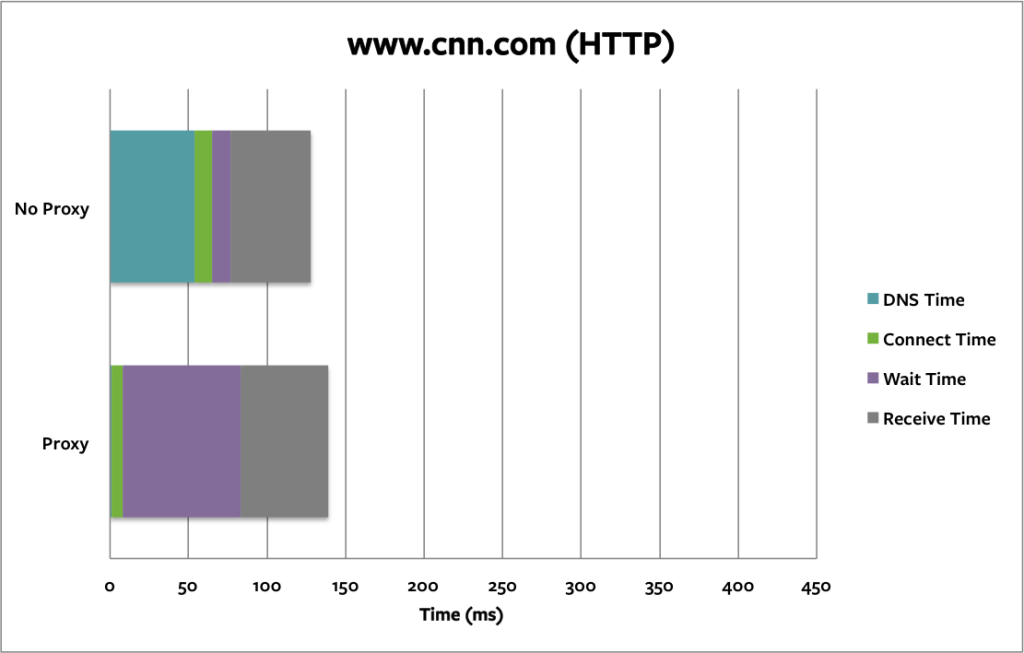
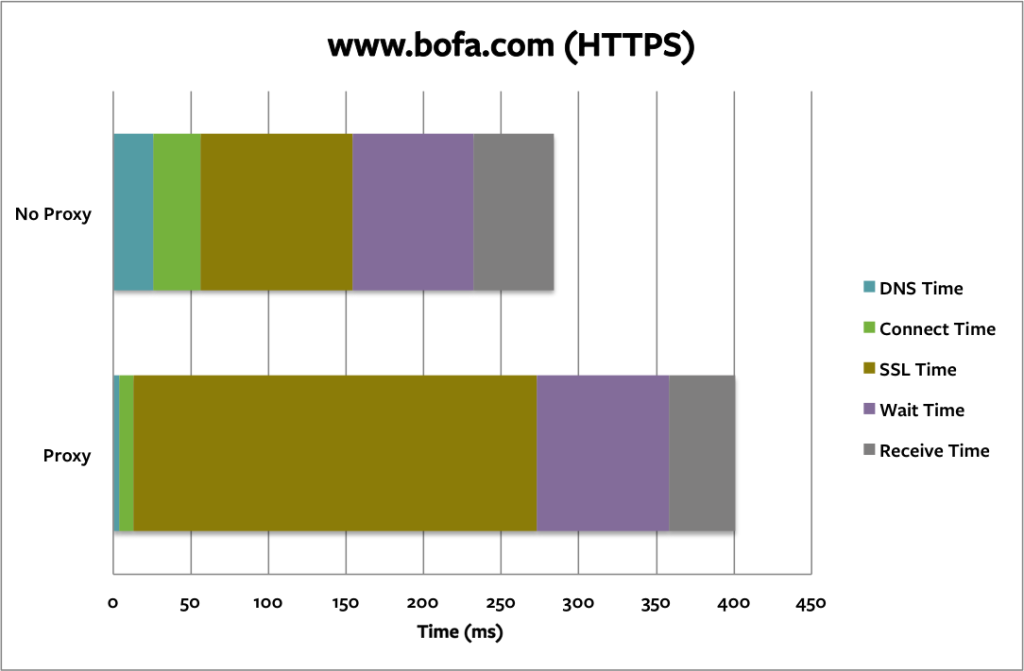
To show how the values of the five steps can change with real websites, we performed some measurements of a cURL client against http://www.cnn.com and https://www.bofa.com with and without a proxy. Below are our results.


In both cases, the effects of using a proxy are clearly visible. We see very small DNS and connect times since the proxy’s DNS name was cached and was close to us on the network. As predicted, we see a large increase in wait time for cnn.com corresponding to the DNS and connect times being hidden in this step. For bofa.com, the SSL time jumps considerably while both the wait and receive times are in line with the non-proxied values.
Proxy Timings in Chrome
In the case of a proxied HTTPS connection, it is interesting to note that the way cURL times a request is a bit different than the way Chrome reports timings (seen in our “Page Load” tests). Specifically, the time between the “CONNECT” and the “Connection established” messages is included in the connect time for Chrome, while cURL counts it as part of the SSL time. The overall effect is not huge, but it is something to be aware of when trying to compare timings between cURL and Chrome.
Conclusion
In this blog post, we have covered timing web requests both with and without proxies, and how the results may be skewed if proxies are employed. Since HTTP proxies are ubiquitous in enterprise environments, we need to be careful interpreting results when measuring site performance through them. Although proxies can speed up object loading if page content is cached locally, they can also hide the true performance characteristics of the site being monitored.