APIs have quickly become an essential building block in modern-day application architectures, both for quick and easy access to services within the app itself and for access from external services. On average, it is estimated that developers use between 10 to 15 APIs per application. As these API-centric applications move to the cloud and become distributed, the increasing dependency on external environments, third-party providers and Internet paths continue to remain a challenge for IT teams responsible for managing application performance and end-user experience. In this fragmented ecosystem, how do you monitor application performance along with API dependencies while not losing sight of the customer experience?
In this blog post, we’ll dive into how the changing landscape of modern app architectures leads to multi-cloud interactions and its impact on application performance, and explain how you can proactively monitor these external dependencies.
Multi-Cloud: An API-Driven Reality
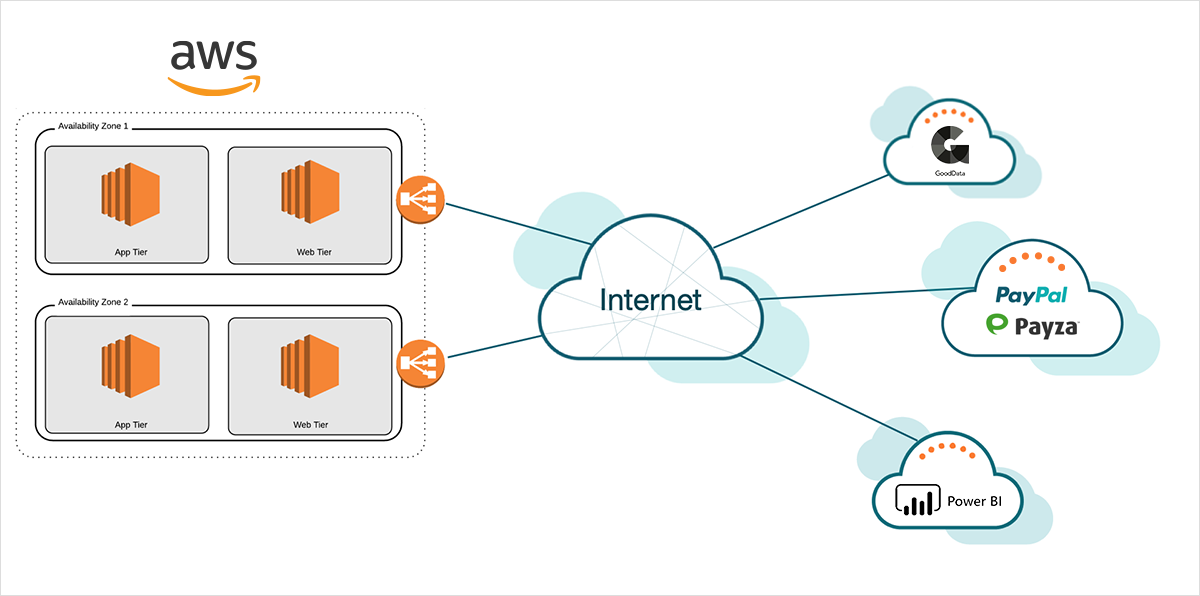
API calls that traverse multiple clouds and the Internet introduce yet another variable when it comes to application performance. The Internet is a best effort network, not built for enterprise communication, and is highly vulnerable and fragile. In 2017, The Internet Society recorded over 14,000 routing errors and outages. The increasing dependency on such external environments with cloud-based and API-driven architectures is what makes monitoring in the cloud more challenging than ever.
But Don’t Cloud-Native Monitoring Tools Help?
Monitoring tools like CloudWatch excel in providing operational and monitoring data through logs, metrics and events. It provides a unified view of how AWS resources are performing, but it lacks an end-to-end view of performance. CloudWatch cannot provide visibility into the Internet, cloud network performance or multi-cloud network paths, leaving a critical gap in your IT monitoring stack. In addition, resilience is also a common concern while relying on monitoring services provided by cloud providers. For example, when the cloud provider has an outage, the monitoring services hosted within the cloud provider can also go down. For example, the S3 outage in 2017 caused by an internal error also impacted monitoring services, leaving enterprises blind on the status.
Good Data: API Connectivity Issue
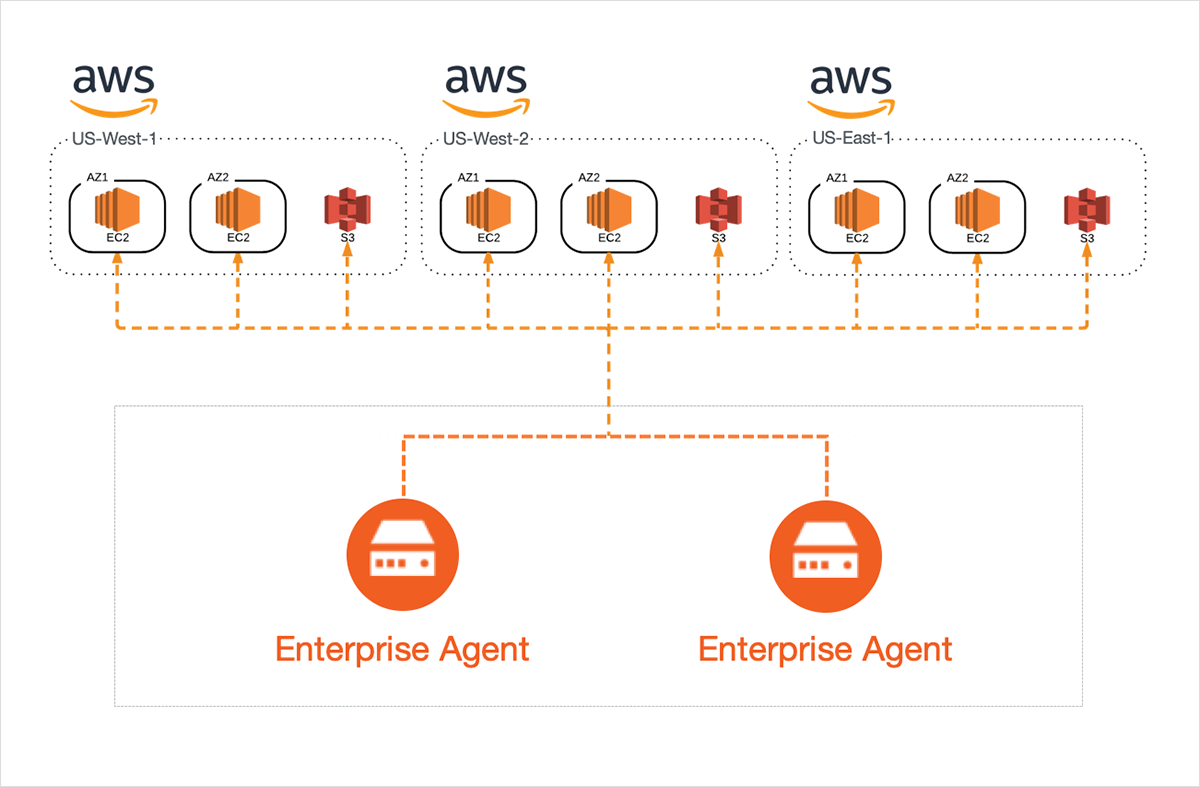
Let’s walk through a scenario where an application hosted in AWS interacts with an external business intelligence platform called Good Data that is hosted in Rackspace. In the following example, monitoring vantage points or agents are deployed in multiple VPCs across global AWS regions. This allows us to monitor the availability and performance of an external API from the perspective of where it is being accessed from.
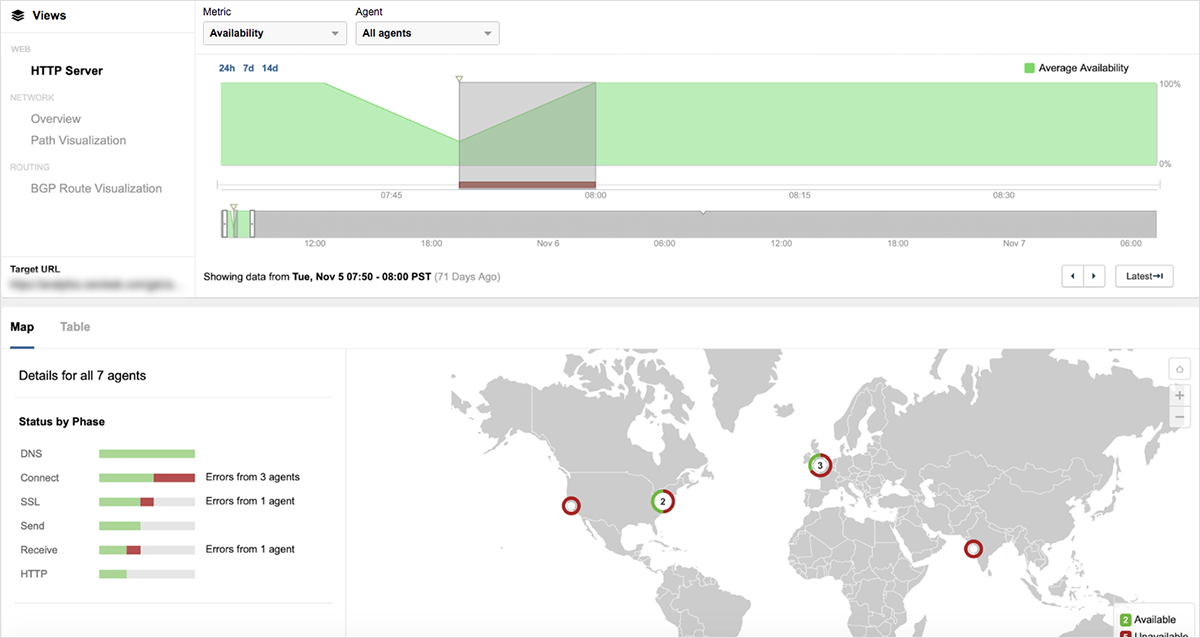
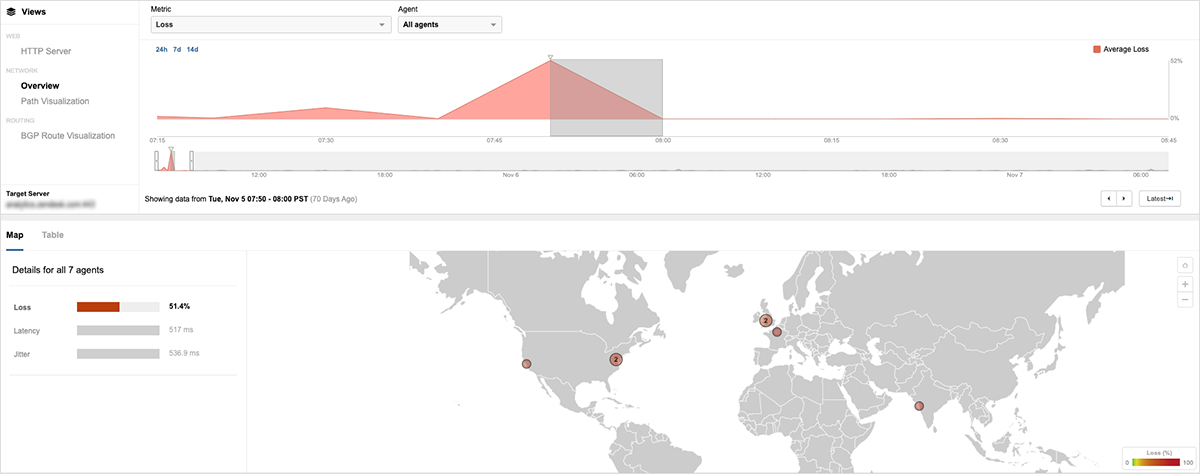
Starting at 7:40 AM PST, we notice a dip in availability of the external API endpoint from AWS. The map view suggests that this drop in availability is not localized to an AWS region, but rather has a global impact. A breakdown of the HTTP connection phases indicate a combination of errors—from being unable to even connect to the API endpoint to SSL issues. Connect errors in the HTTP phase mostly indicate that this could be an underlying network issue. To validate our hypothesis, let’s jump into the network layer.
Once at the network layer, we notice that the end-to-end packet loss at the exact instance spikes to 52%.
A deeper look into the end-to-end path through Path Visualization (Figure 4) indicates that the high packet loss is confined to Rackspace, which is where the API endpoint within Good Data is hosted. Notice that the network paths within AWS and Internet paths connecting AWS to Rackspace show no network loss or high latency.
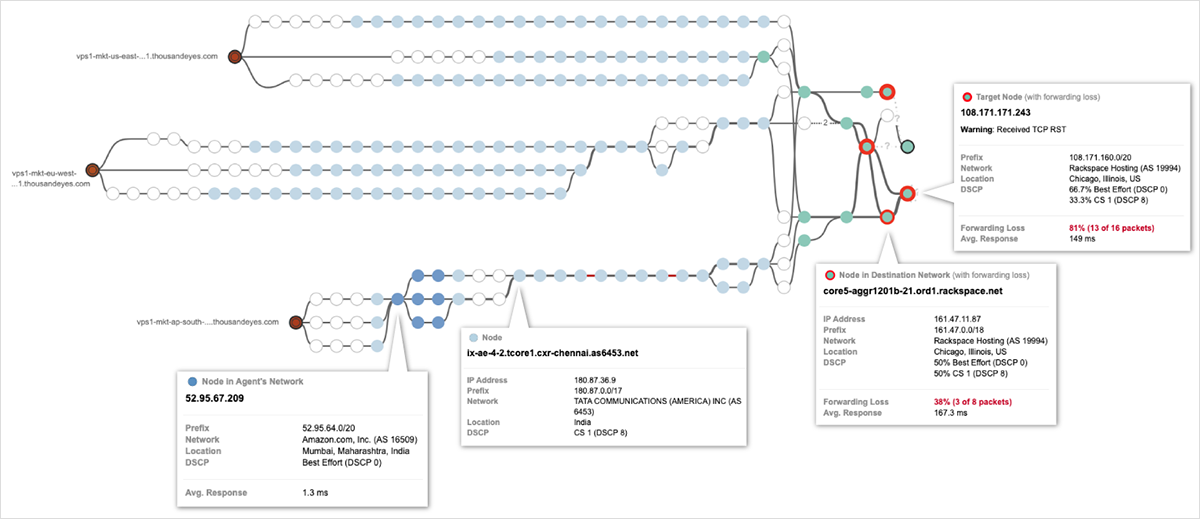
In this particular scenario, as seen in Figure 4, we have clear evidence that the issue was within Good Data’s hosting provider Rackspace, and not AWS or even the Internet. However, this is not always the case, as there have been events in the past where outages within a cloud provider or an upstream ISP have disrupted application availability. And in a distributed environment, such as a hybrid or multi-cloud scenario, knowing where the problem is can be extremely challenging.
In today’s enterprise environment—where the Cloud is your new data center, and the Internet (and your cloud provider’s backbone) is your new enterprise network—it is critical that you can see and manage this infrastructure as if it belongs to you. ThousandEyes gives you a real-time map of how your customers, employees and workloads reach and experience internal and external applications and services across all of your private networks, cloud provider networks, and all of the Internet-based dependencies in between.
How Can You Monitor Your API Endpoints and Multi-Cloud Paths from AWS
ThousandEyes Enterprise Agents can be deployed within cloud provider networks to get visibility into external API and multi-cloud interactions and communication paths. Available in a variety of form factors (physical/virtual appliance, docker, Linux package, etc.), Enterprise Agents that are within your cloud environment allow you to monitor from the vantage point of your applications and microservices. These agents can be installed as a simple EC2 instance within AWS and occupy a very small footprint. For example, Enterprise Agents can be installed as t2.medium instance with 2 vCPUs, 4GB RAM within a VPC. CloudFormation templates that are pre-defined and pre-configured make deployment extremely easy. It is a simple 3-click process to get the agent up and running. For a step-by-step walkthrough, refer to our deployment guide in the ThousandEyes knowledge base.
While Enterprise Agents can give you "inside-out" visibility from your VPCs, ThousandEyes Cloud Agents can provide you with "outside-in" visibility and are representative of how customers connect to your applications. ThousandEyes Cloud Agents are installed around the world in Tier 2 and Tier 3 ISPs and mobile providers, allowing you to monitor performance to your AWS regions.
The Approach
Adopt a proactive approach when monitoring an API-heavy application ecosystem. Native cloud monitoring tools create a blindspot in monitoring paths outside of the cloud provider’s network. Dependencies in multi-cloud environments and the unreliable Internet require a new approach to monitoring—one that factors in rapidly shifting baselines, and networks and applications that you don’t control. ThousandEyes recommends a continuous lifecycle approach to monitoring.
- Take a data-driven approach and ensure readiness by monitoring your API-heavy applications prior to roll out. See how our customers like Atlassian and Intuit use ThousandEyes to monitor their AWS and hybrid-cloud deployments for visibility in the readiness phase.
- Establish clear success criteria for your deployment, and train your DevOps and IT teams on new escalation processes. Teams place a premium on how the end-users are consuming and experiencing these apps.
- Continue to monitor and benchmark your app performance, and monitor end-user metrics, in order to get ahead of issues, and ensure a great user experience.
Start monitoring your business-critical API-based applications today with the ThousandEyes free trial and thrive in your multi-cloud environment.

