
Introduction
Introducing an Application Performance Management (APM) and Distributed Tracing tool is key to keeping a distributed software ecosystem healthy. We use this fundamental tool to track our platform performance and better understand how requests are flowing through our infrastructure and to trace internal service performance.
Without proper observability tools to gather insights about our microservices, we have relied on traditional monitoring. While this was enough to have a high-level picture of our services performance, to further enhance our knowledge, we need to manually augment our code to get fine-grained measurements. With an APM tool, an Agent is attached to the service runtime environment so this agent will automatically hook to specific code paths and gather relevant performance metrics without the need to perform code changes.

Observability
Observability is a term from control theory introduced in the 1960 by Hungarian-American engineer Rudolf E. Kálmán for linear dynamic systems.
In control theory, observability is a measure of how well internal states of a system can be inferred by knowledge of its external outputs. The observability and controllability of a system are mathematical duals. 1
For a system to be observable, an exterior actor needs to be able to observe the system’s internal behavior without having to change it. In the case of a software system, this means new code or a configuration change doesn’t need to be shipped to be able to answer new questions about the system performance.
Looking at the way traditional monitoring is performed, this a fundamental change that goes inline with the growing system complexity that undermines our ability to predict where a system will break before hand.
Benefits
The main benefit of adopting an APM tool was to be able to identify bottlenecks and quickly find problematic changes at the code or configuration level. As a result, we can improve our code to be more efficient and by consequence have faster development cycles, faster services and better customer experience.
Implementation
The main reason why we chose Elastic APM was our experience running the Elastic stack, but also because it is an open source stable solution that fits our requirements.
After performing a quick proof of concept collecting transaction from a single service, we were able to understand how the tool works and the potential value. Given this, we decided to move forward and the following high-level tasks were performed in order to deploy it to production:
- Deploy the latest version of Elasticsearch in Google GKE
- Deploy the latest version of Kibana in Google GKE
- Deploy the Elastic APM Server in our Kubernetes clusters
- Instrument JVM base services using the Java agent
- Integrate the Real User Monitoring Javascript library in our Web applications
Infrastructure Architecture
According to the experience gathered during the initial POC, we proposed a simple deployment architecture (Figure 1) were the Kubernetes cluster has an Elastic APM Server deployment that will receive the metrics from all namespaces and send them to the ElasticSearch cluster in GCP.
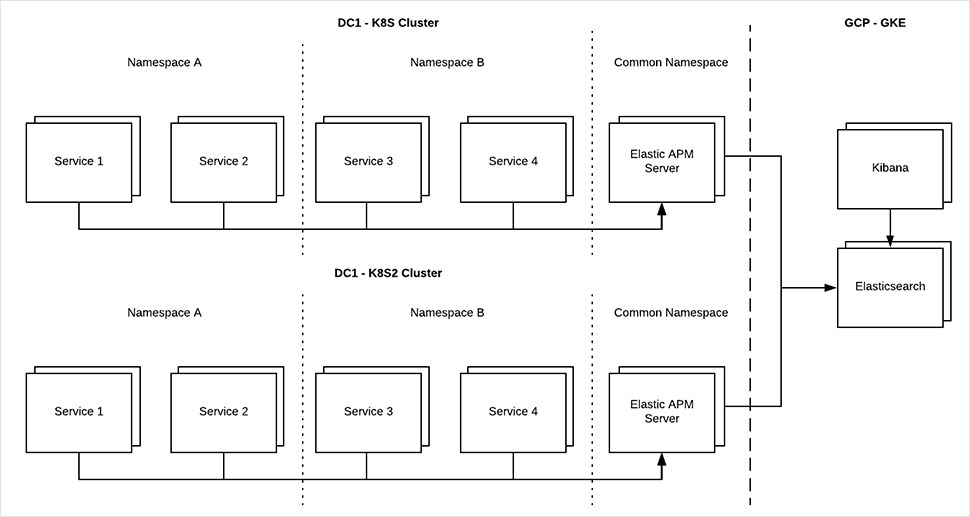
As a result, we were able to quickly integrate the Java and Javascript agents with many services and start seeing the value of the visibility given immediately.
Deploying the Elastic APM Server
If a kubernetes cluster is already being used, the quickest way to deploy the Elastic APM server is to create deployment files based on the existing Elastic APM Docker image.
To achieve this, first we need to create a config map that will define the Elasticsearch used to store the data generated by the APM agent and the Kibana instance being used to visualize.
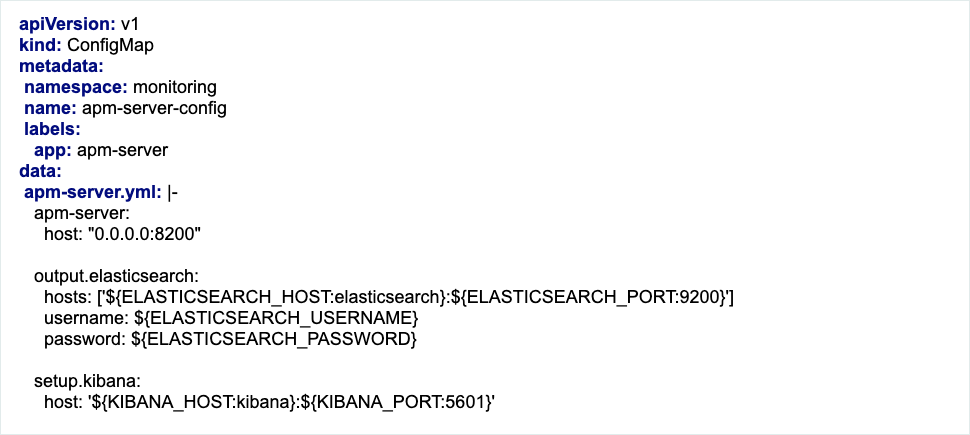
The Deployment defines how the container will be deployed and uses the ConfigMap to configure the APM server.
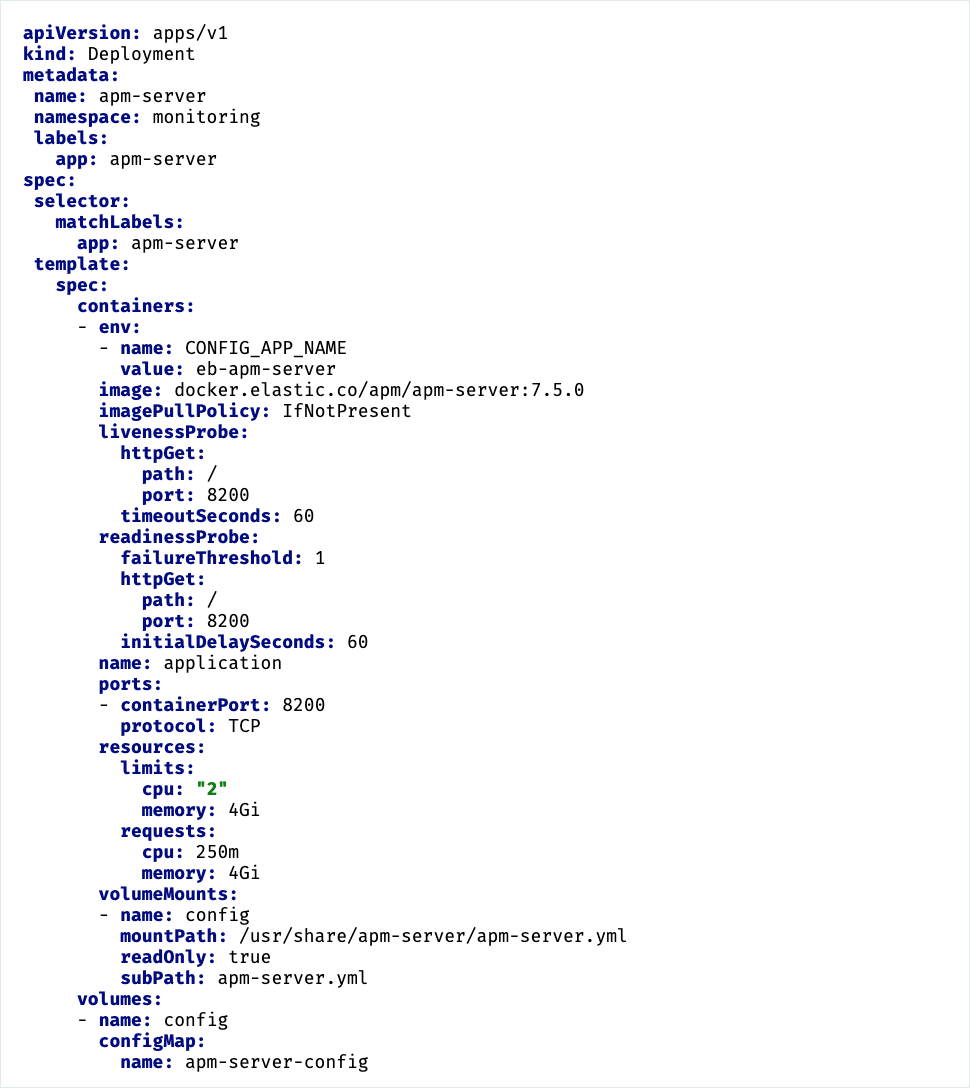
Finally, we define the Service that will expose the APM server port to the kubernetes cluster.

After defining the deployment files, they can be applied to the Kubernetes cluster using kubectl.

After applying the deployment files to verify if the deployment is up and running, we can use kubectl.
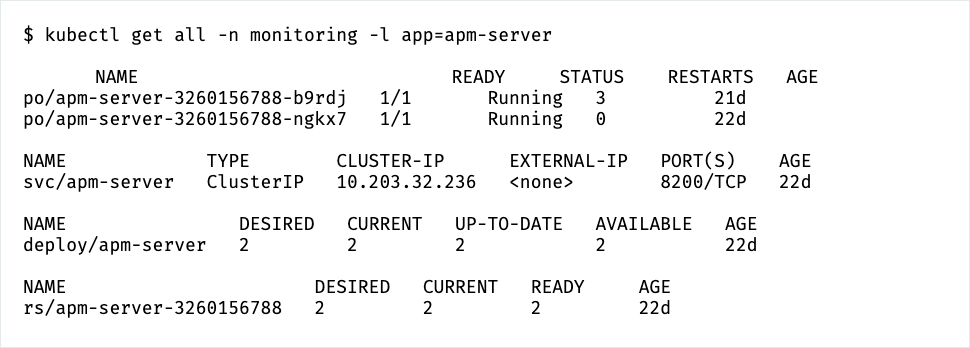
After successfully deploying the APM server, any Kubernetes pod can access the service using the internal service name http://apm-server.monitoring:8200.
Integrate the APM Agent on a JVM Based Service
The JVM javaagent flag can be used to specify the path to the APM agent jar and the Delastic.apm.service flags are used to perform the agent configuration.

Integrate the APM Agent on a Spring Boot Application
Integrating the APM agent on a Spring Boot based service is straightforward. Just use the ElasticSearchAPMAttacher class to perform the operation.

Tracing GRPC Service Calls
Currently, GRPC service call is not supported out of the box, but since OpenTracing bridge is available, this can be achieved by using the opentracing-grpc library.

Tracing Kafka Processing Services
Tracing Kafka processing services is not supported out of the box; however, we were able to use the CaptureTransaction annotation to instrument these specific methods.

Performance Tuning
Introducing an APM agent on a service should impose a very small overhead, but remember to be careful with the number of traces being collected. On a full fledged production system, it will be impossible to collect 100% of the traces and the collection of stacktraces and request headers will increase the amount of data being collected and stored, thereby affecting service response times.
APM Agent in Non-JVM Based Services
Elastic APM has different agents available, so follow the instructions to perform the installation.
Data Collected
After the integration was completed, transactions and spans started to be collected, distributed tracing worked as expected and we were able to see the value of having observability in our stack immediately.
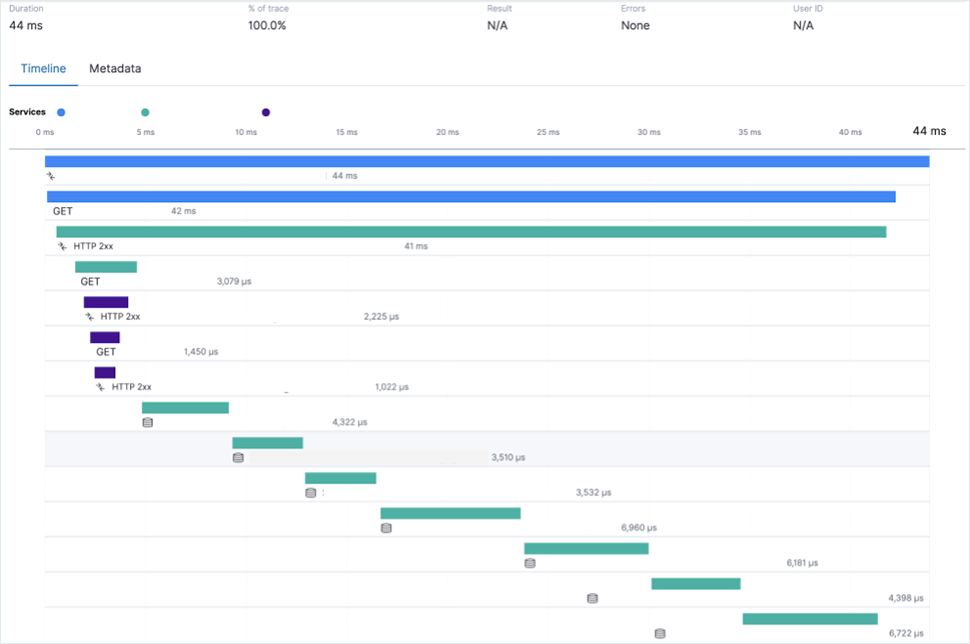
Figure 2 presents an example of a distributed tracing transaction that flows across three different services. In this particular case, we are also able to identify the MySQL queries being performed. In case we have a performance degradation event on this particular endpoint, the detail and quality of the information collected will be fundamental to pinpointing the root cause.
Time Spent by Span Type
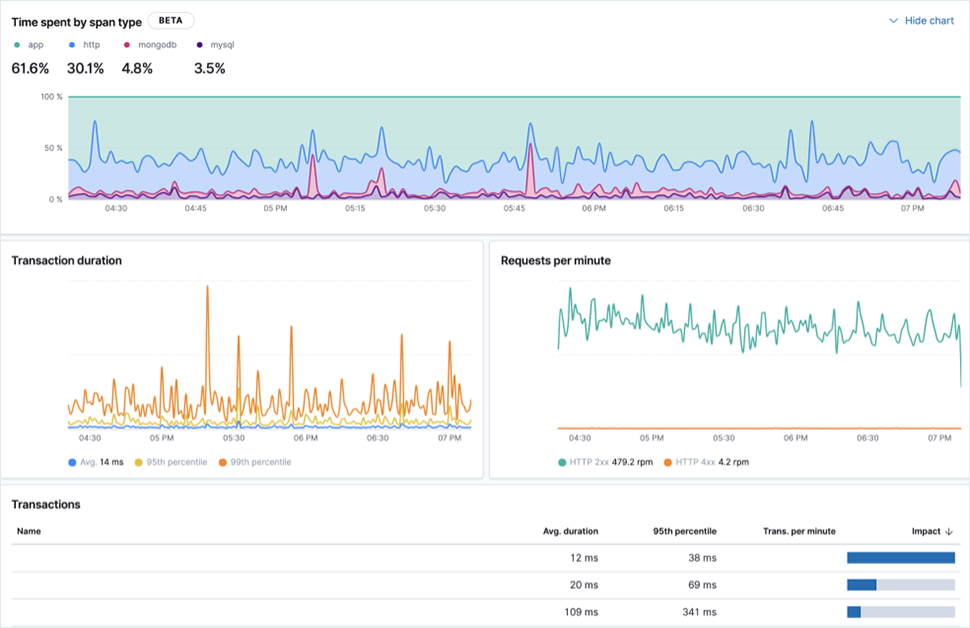
Another interesting aspect of the data collected is the ability to see the time spent by span type (Figure 3) this can include time spent within the application or calling external services like MongoDB or MySQL.
Real User Monitoring
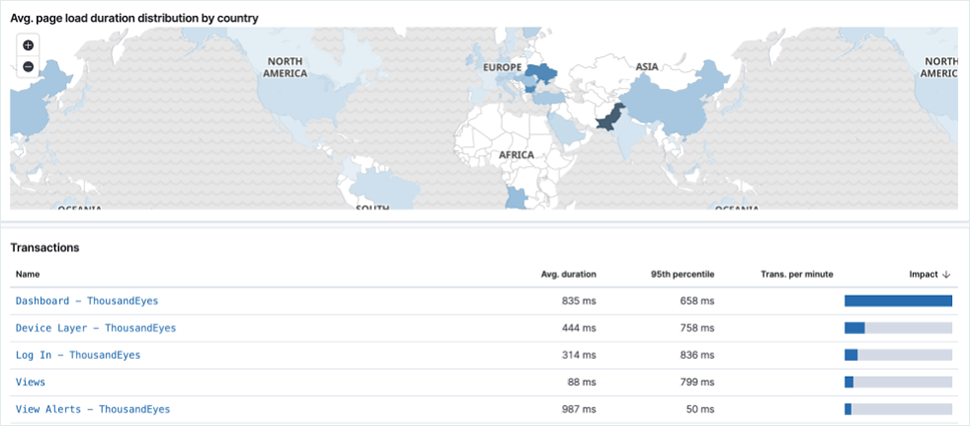
The ability to understand our platform performance from the user point of view also give us great insights on the user experience.
Conclusion
On a modern distributed system, having the power to observe how a service operates internally and being able to trace requests across different services is key to lower the mean time to recovery (MTTR) when an unexpected behavior occurs.
As we continuously collect detailed data about our services, we are able to identify usage patterns with greater accuracy and understand their correlation with the services internal or external calls.
One of the blind spots we were not able to cover until now are services written in C++ because this entails using the existing Elastic APM public API to instrument the code and generate transaction and spans.
In the end, the most important aspect of observability is being able to keep our customers happy by proactively fixing performance issues before they are even visible by an external observer and reducing the MTTR when an unexpected event strikes.
This article described the stepping stones of our journey to observe our platform in great detail. This initiative will continue to evolve in the coming months and years to further enhance this capability.
Stay informed of the continuous innovation at ThousandEyes. Subscribe to our blog today.

