Due to the shift to direct internet access (DIA) from branch offices to SaaS and IaaS, centralized firewalls are giving way to distributed, cloud-based secure web gateways. These security proxy services include URL filtering, advanced threat defense, malware and antivirus protection, and application control.
However, this deployment model creates major blind spots for IT and Network Administrators, since network paths to reach the cloud security nodes include the Internet. Legacy network monitoring tools that rely on passive data collection aren’t relevant since you can’t collect data from routers you don’t own.
ThousandEyes actively probes the network, a unique monitoring technique to provide a complete hop-by-hop picture of performance between branch users and SaaS or IaaS servers, plus all the intermediate SWG providers. In this blog post, we’ll show how ThousandEyes works with customers on monitoring cloud security proxy deployments. While this blog post uses Zscaler as an example, the concepts discussed apply to other cloud security proxy solutions like Imperva and Cisco Cloud Web Security (CWS).
Zscaler Service Architecture
The Zscaler platform is a pure play cloud solution based on a scalable, multi-tenant platform that functionally distributes components of a standard proxy to create a giant global service network.
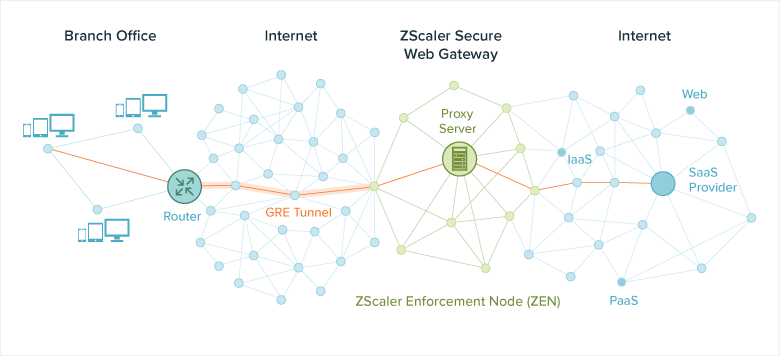
Zscaler offers multiple access options but typically enterprises send traffic from branch offices to the closest Zscaler Enforcement Node (ZEN) via a GRE Tunnel from their on-site Internet router or firewall. User traffic at the ZEN is inspected by a inline proxy that enforces security policies (like URL filtering, advanced threat defense, malware protection and application control) with user-level granularity. Each ZEN then sends traffic over the Internet to the SaaS provider. The traffic path is illustrated in Figure 1.
A Real-World Event Analysis
Let’s look at a real-life event we captured and walk through how ThousandEyes helps you quickly isolate the root cause of a Zscaler performance issue and take remedial action.
Around 8 am, you start receiving calls from users complaining of slow access to Salesforce. Luckily, you have ThousandEyes so you also receive automated alerts showing high page load time and HTTP server errors.
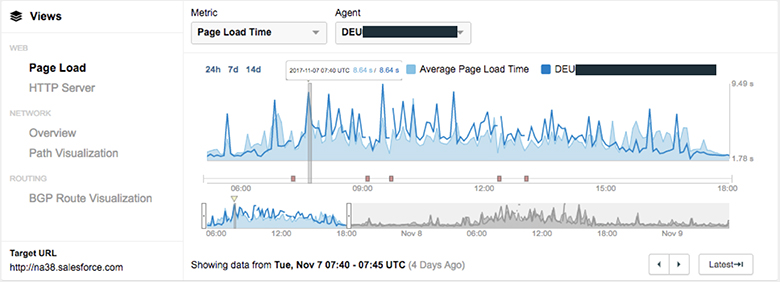
You log into the ThousandEyes platform, which provides detailed information about the end-user experience for accessing Salesforce. Looking at the Page Load view (Figure 2), you see a spike in the page load time. Under normal operations, the Salesforce login page takes around 1 second to load, but now it is taking almost 10 seconds.
So you jump into the HTTP Server view (Figure 3), and see a high number of HTTP (connect, SSL and receive) errors and a spike in HTTP Server response time. ThousandEyes also provides details of the exact errors as shown in the red boxes.
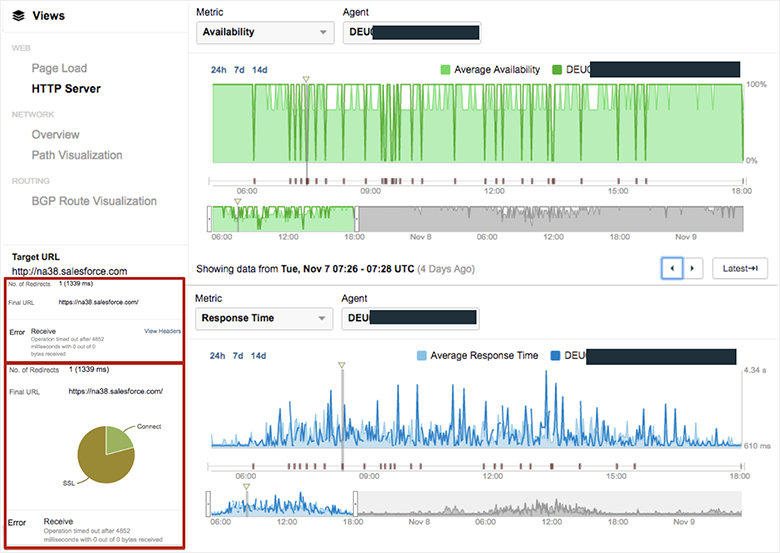
These observations are symptomatic of network layer issues like high packet loss and congestion, so to get further insight you move to the network layer view for troubleshooting.
Network Path Troubleshooting
Like most Zscaler deployments, your organization uses a GRE tunnel to send traffic to the most optimal ZEN. To test the health of the underlying Internet connectivity from the branch location to the Zscaler ZEN, you’ve set up a network layer test to the Zscaler GRE Virtual IP (VIP) address as published in the Zscaler customer portal. The test provides latency, jitter and packet loss data from the branch office to the ZEN GRE VIP, as well as per Layer 3 hop in the network path.
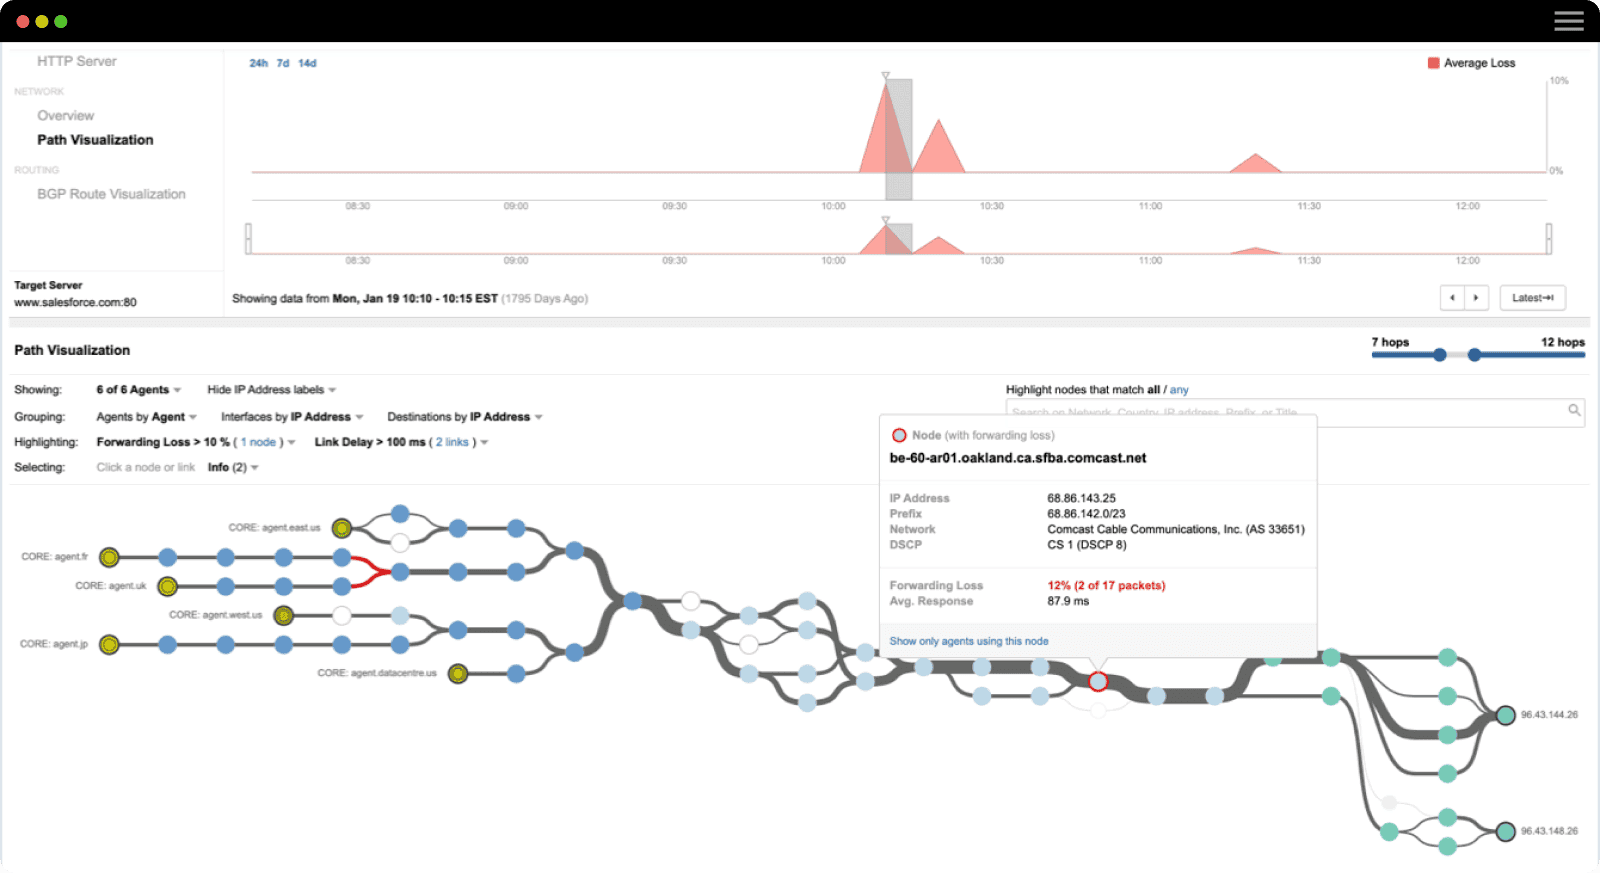
From this monitoring test, you can see that starting at 8am CEST, there was high packet loss from your branch office to the Zscaler Frankfurt ZEN GRE VIP address. You then scroll down to the Path Visualization which shows the full path and the specific nodes where the packet loss was happening, as seen in Figure 4.
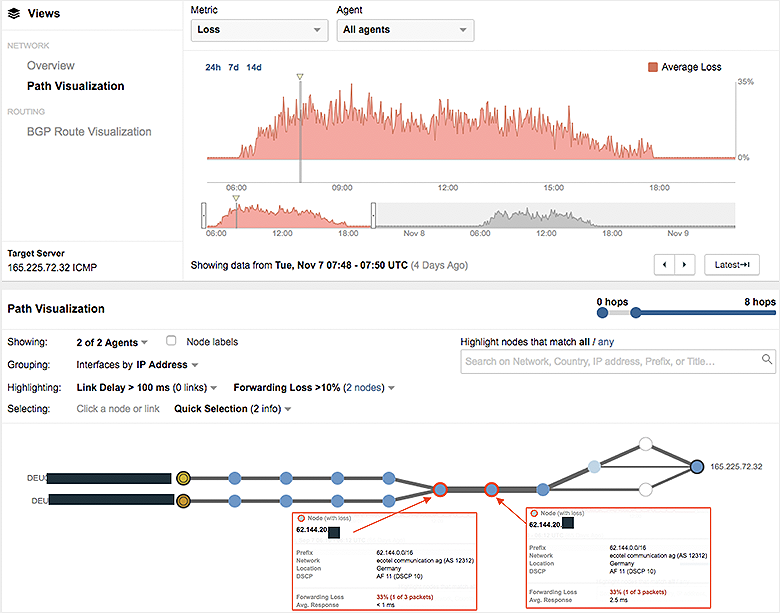
This supports your initial suspicion that the Salesforce issue is due to network issues, because you can see packet loss and congestion occurring at specific routers in the upstream ISP — Ecotel Communications (AS 12312). But to be sure, you continue investigating to see if there are issues in other network segments.
Checking connectivity from enterprise branch office to Zscaler ZEN Proxy
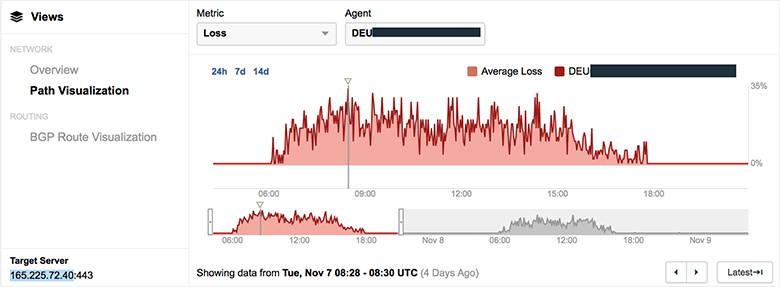
Aside from the monitoring test to the ZEN VIP, you’ve also set up monitoring the specific proxy server your users are connected to. As we can see in figure 5, this branch office users connect to proxy IP address 165.225.72.40 in the Zscaler Frankfurt ZEN. You can see a spike in packet loss that correlates with the loss to the Zscaler ZEN Frankfurt GRE VIP.
Checking upstream connectivity from Zscaler ZEN to SaaS provider
Last, you check the test you set up for upstream connectivity from the Zscaler ZEN to Salesforce. In figure 6, you can see the end-to-end path from the ThousandEyes agent in the branch office, going through the Zscaler Frankfurt ZEN to na38.salesforce.com. You can see that user traffic transits via upstream provider Zayo’s network from Frankfurt to Amsterdam, then to London, and across the Atlantic to Washington D.C. where it is handed off to the Salesforce network in the Ashburn, VA Equinix data center. The traffic then goes through Salesforce internal network to Phoenix, AZ where the service instance is hosted.
You can also see that as the traffic enters the GRE tunnel the MTU has reduced from 1500 to 1476 (due the 24-byte GRE header overhead) — as shown in the Blue callout below. This information can be crucial when trying to troubleshoot MTU related performance issues.
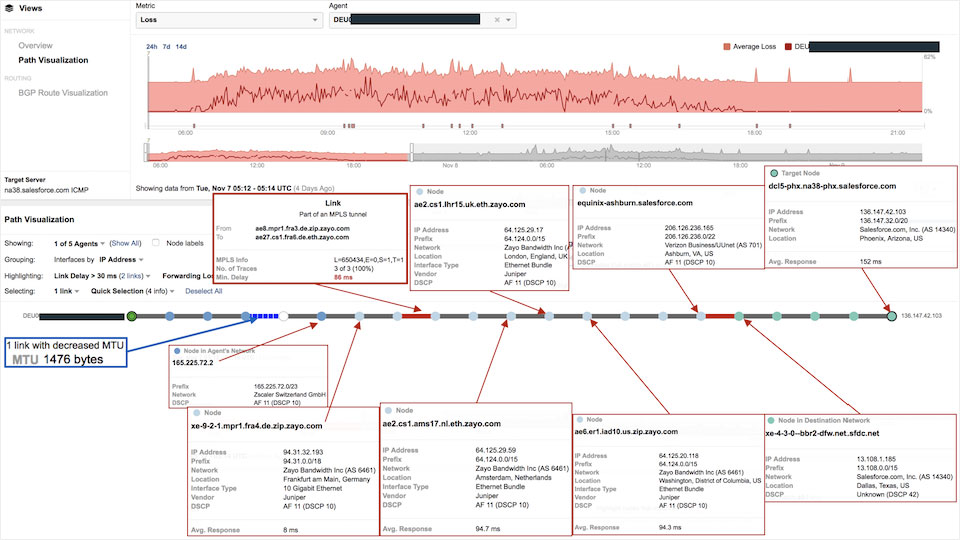
There’s no performance issue upstream of the Zscaler Zen, so you can now confirm that the root cause of this issue is high packet loss in specific routers in the Ecotel Communications network. You can now use ThousandEyes’ collaboration capabilities to share an interactive snapshot of your findings as part of a service escalation.
End-to-End Insight Like No Other
This Zscaler event is a great example of why you need ThousandEyes. With cloud services, your network paths are far more Internet-based. Your monitoring capabilities need to keep up or else you’ll be stuck with the responsibility for user experience without any way to troubleshoot, let alone resolve problems.
Only ThousandEyes is able to give you this end-to-end intuitive visualization of a complex network environment across your corporate network, the public Internet, the cloud security proxy (Zscaler or otherwise) and the end SaaS destination while linking it to application performance.
If you’d like to read more about the overall approach to monitoring cloud security proxy services, check out this companion white paper. Ready to experience the power of ThousandEyes for yourself? Sign up for a free trial or request a demo.
