Every application architect desires a loss-free end-to-end path. As we previously discussed in Part 1: The Surprising Impact of 1% Packet Loss, it is evident that even the smallest amount of packet loss can cause significant throughput degradation. In fact, a mere 1% packet loss was shown to have a catastrophic impact on TCP throughput. Yet, we know that TCP has been designed to deal with these types of situations. The same mechanisms used by TCP to maximize throughput and to account for data loss by retransmitting missing data also power the efficiency and usability of your cloud and Internet delivered TCP applications.
We also recognize that network loss does happen, whether due to resource contention, a hardware fault, or human error. So how does similar packet loss impact your applications and digital services? Should you rally the troops any time you observe at least 1% packet loss? For application performance, there are additional factors to consider beyond packet loss percentages. In practice, the amount of performance degradation can fluctuate considerably based on additional application-layer elements as well as the nature and location of the loss.
You really just want to answer these fundamental questions:
-
When network degradation occurs, what is the user-perceived impact on the applications for which you’re responsible?
-
How will you know when users are experiencing poor performance with these applications?
-
Can you deploy, monitor, and manage digital services in a way that maximizes user experience?
Despite these questions being rather foundational, actually knowing how to get to the answers can be challenging. That’s because not all applications will react in the same manner to the same levels of network degradation. Nevertheless, the following is also always true: data dropped by the network, or data that arrives late, or data that arrives out of order, will always be the bane of healthy application performance.
Let’s start by looking at the requirements applications have for the network and how these requirements can differ between applications, despite each of them wanting timely network communication delivered to endpoints as loss-free as possible and as orderly as possible.
Many Application Variables
Application behavior plays an important role in the overall impact that packet loss can have on the user experience. For example, does the application require a lengthy, persistent TCP session? Does it move large amounts of data, such as with video or images, or is it mostly transactional with smaller amounts of data, such as API calls or SSH sessions? Does the application bring data together from many different sources to create a single user experience, such as many of today’s modern web applications?
From a user experience perspective, some applications respond better than others to increased packet loss. This is why it’s necessary to directly measure the individual application in question to understand how packet loss impacts its specific performance. This is in addition to measuring the end-to-end performance of the various IP networks the application utilizes. Different applications can handle problems in different ways. For example, a web application front-end may send HTTP 500 responses when there is an issue on the web server side, or when an important application dependency is timing out, or perhaps when a particular script is taking an undo amount of time to process. This HTTP 500 response is, therefore, essential information to know if you support that application.
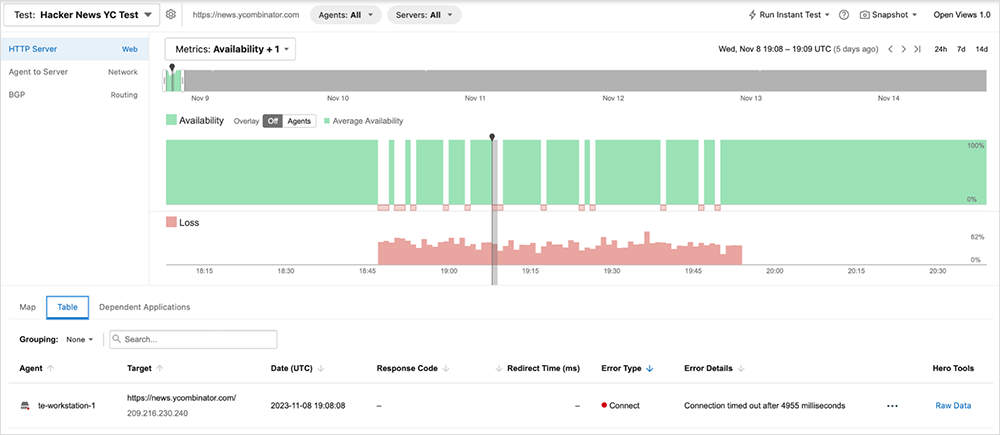
ThousandEyes’ layered synthetics accommodates multiple types of probing and enables you to correlate issues over exceptionally short periods of time. Figure 1 shows the impact of packet loss on web server availability. Availability represents the ability to successfully complete several different tasks, such as DNS resolution, establishing a TCP connection, negotiating a TLS session, and more. Figure 1 shows a spike in loss that directly correlates with a drop in server availability, highlighting the relationship between the two layers (L3 impact having negative consequences on L7).

Many Loss Variables
The other important factor in understanding the impact of packet loss is the nature of the loss itself. Just knowing the percentage of loss over a timeframe is not terribly helpful if there is nothing actionable resulting from that information. First, what is causing the loss? This seems like an obvious question, but it warrants a mention. Loss is caused by two primary things: 1) Faults, or unexpected events in hardware, software, or design that impact normal function and healthy traffic flows; and 2) Resource constraints somewhere in the end-to-end path, whereby a data forwarding node is handling too much load and begins dropping IP packets. Each of these conditions has very different remediation strategies.
If the event is not due to a fault, it would be helpful to know if the observed loss is sustained or brief, as well as if it is intermittent or persistent. Continuously measuring and baselining end-to-end performance is critical to understanding the full behavior and helps to inform actions for fixing or improving faults and lossy paths.
Many Networks
It also matters where the loss occurs. If it’s in your environment, there may be a way to apply a direct fix. An issue within an SD-WAN fabric, for example, may be able to be remediated using normal SD-WAN controls. Or, perhaps the loss is in a provider environment with whom you have a relationship, SLAs, and support agreements—and so you can call and escalate to the appropriate support team. Furthermore, by knowing the location and behavior of the loss, it might also be possible to steer traffic around the problem by implementing a BGP or DNS change.
One of the most complicated network engineering challenges when dealing with an end-to-end path is identifying where the packet loss is happening. As networks continue to grow and topologies evolve, this problem is becoming more prominent. ThousandEyes can identify where packet loss or other networking-related issues (such as spikes in latency or jitter) are occurring, aiding root cause analysis for effective remediation.

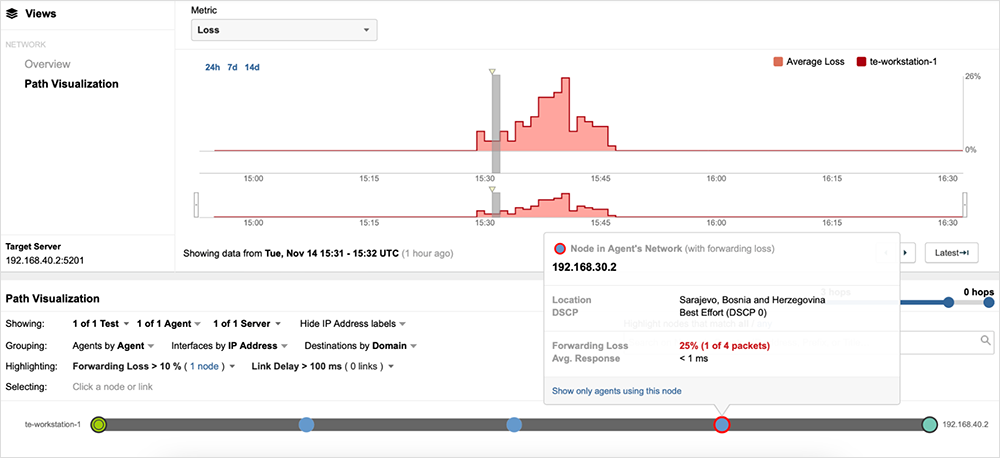
In figure 2, you can see a prominent spike in packet loss on the timeline, which makes it easy for network engineers to easily identify when the issue started and its impact. This timeline view enables network engineers to determine the baseline state of the network before the issue began, what it looked like during the issue, and then what it looks like after the issue.
Beneath the timeline is the Path Visualization. This is a visual representation of the networking path the traffic took. Each circle along the path represents a networking device the traffic traversed. Moving through the timeline also provides a retroactive view of the network paths on the Path Visualization. As figure 2 shows, one of the nodes is circled in red. That is the node that experienced forwarding loss during the observed spike, and troubleshooting efforts can now be focused on that particular device. Figure 2 demonstrates how quickly it is possible to narrow down the node with issues, typically the most challenging troubleshooting task for network engineering teams.
Why and When Do I Care?
Sustained 1% loss has been shown to have a tremendous impact on TCP throughput capabilities. Does this mean that you should fire off alarms and wake the on-call engineer any time 1% loss is detected in an application’s end-to-end path? Not necessarily. While everyone strives for end-to-end lossless network paths, the reality is that the application itself, as well as the nuances of the loss event, matter heavily. It is, therefore, a tremendous challenge to formulate proper monitoring and response strategies without multi-layer data.
What's needed is correlated data sets, using combined measurements, to gauge not only the underlying health of end-to-end IP transports, but also the impact on your specific applications. Understanding the upper-layer impacts from events at the IP layer is critical to isolating the root cause of a problem. Analyzing direct application-layer measurements alongside IP health metrics enables ITOps teams to properly respond to performance events, and it facilitates improved cross-team remediation.
The location of loss also matters operationally. Loss occurs at a specific data forwarding node or nodes, and so knowing what device (and who owns it) is necessary for remediation. It also helps you determine if a service provider needs to be engaged.
Knowing the connection between IP loss and TCP performance is something network engineers intuitively grasp, but linking this to actionable operations strategies, SLAs, and response mechanisms requires a view of the cross-layered and correlated performance picture that takes into account the individual applications and services.