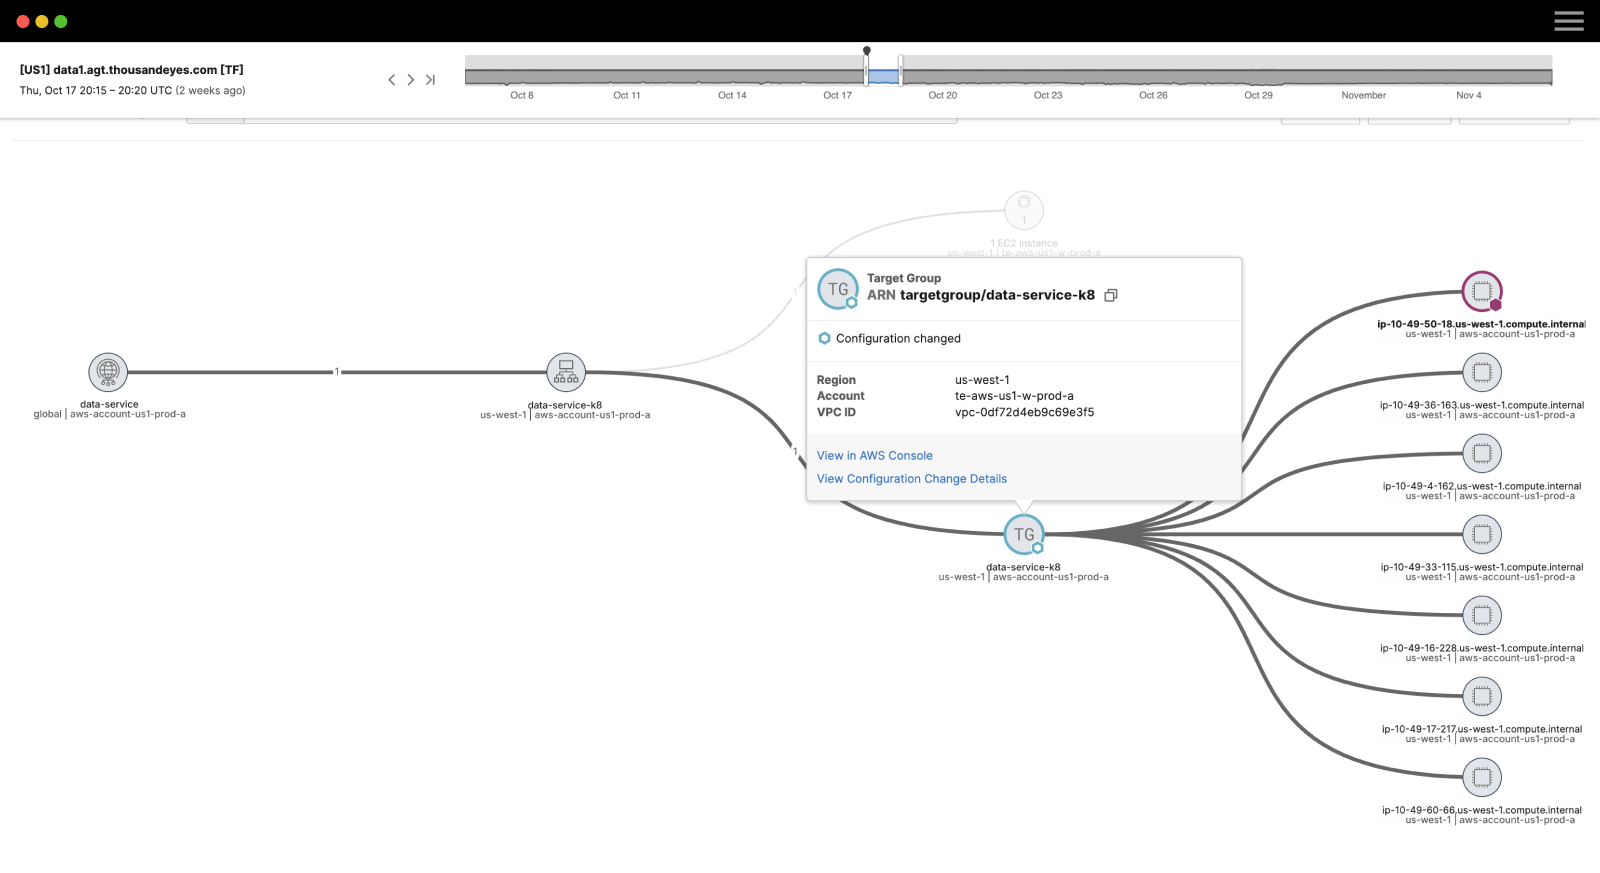
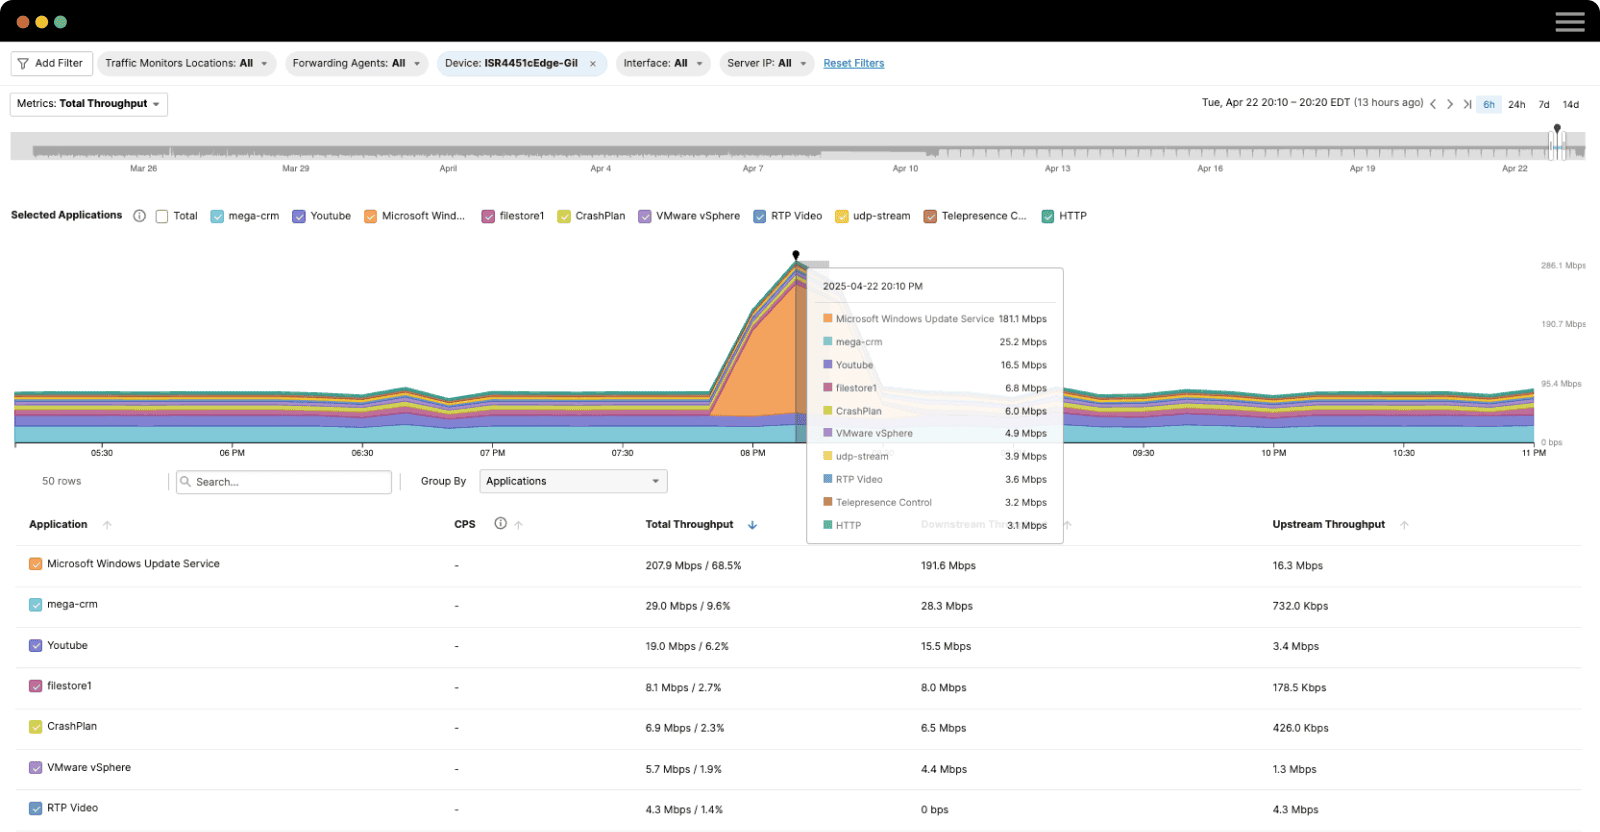
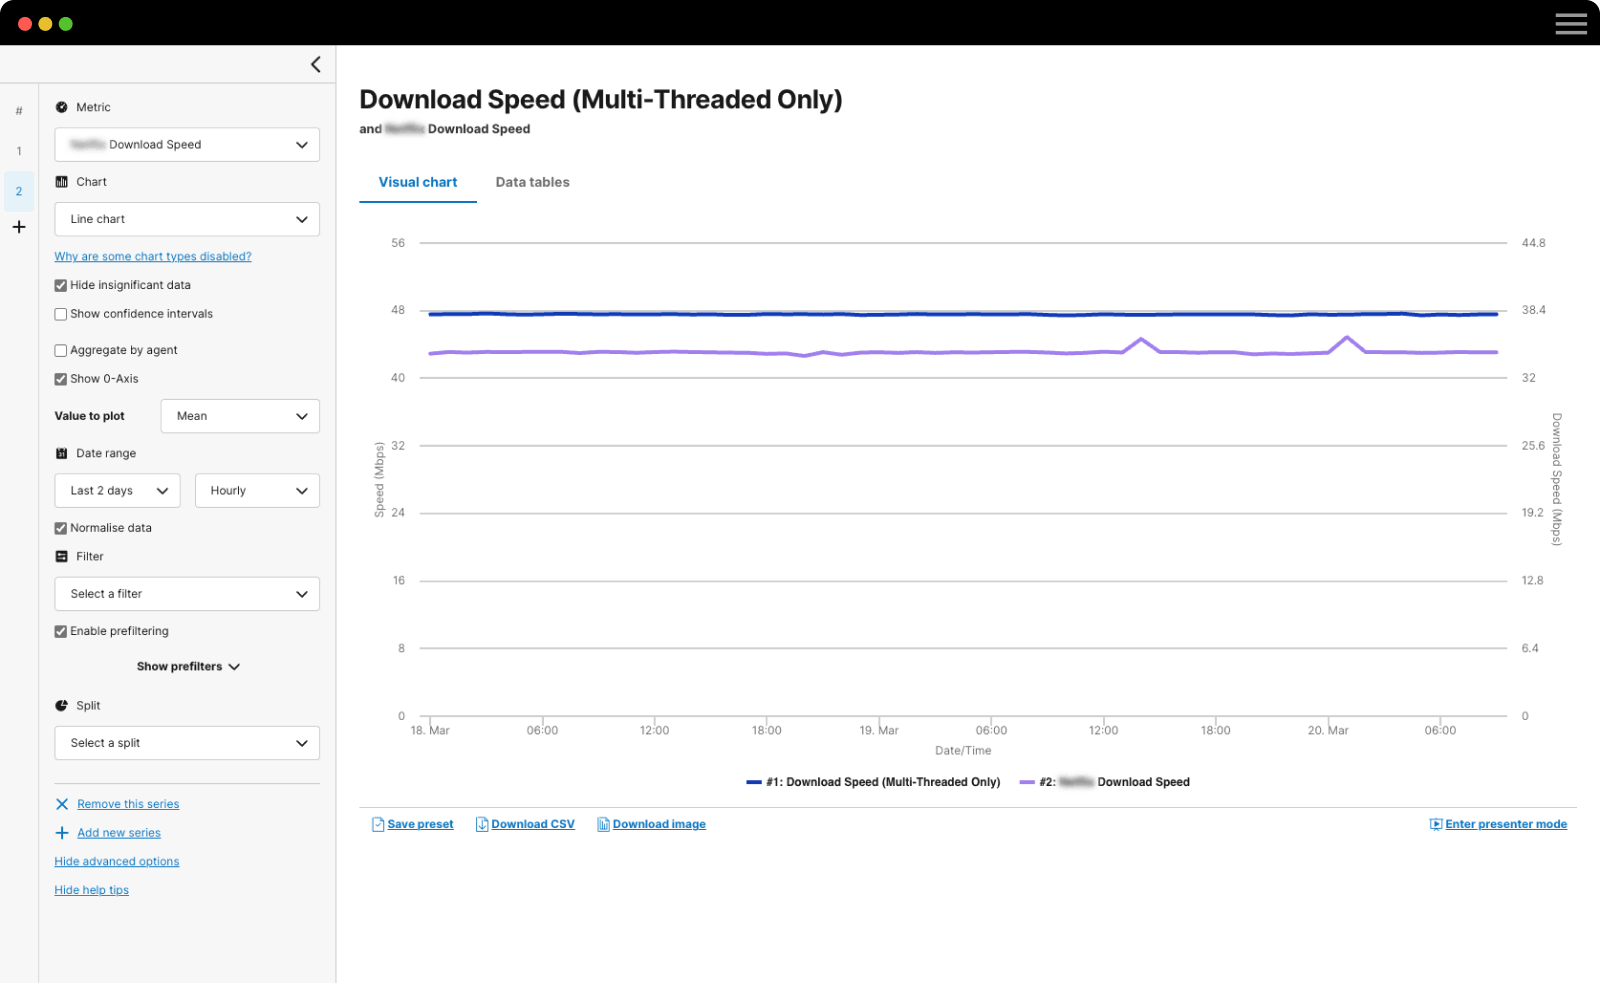
In this blog post, I’d like to focus on a specific piece of ThousandEyes technology: X-Layer. X-Layer is a connecting thread between different application delivery layers, enabling root cause analysis across seemingly disconnected data sets. For example, using X-Layer you are able to pin a web application error to a BGP routing change. We developed X-Layer while trying to troubleshoot some pretty hairy issues our customers were experiencing, some of them involving searching and parsing through GB of data. Once we had X-Layer, we were able to get to the same results within a few mouse clicks.
Layers, Context and Metrics
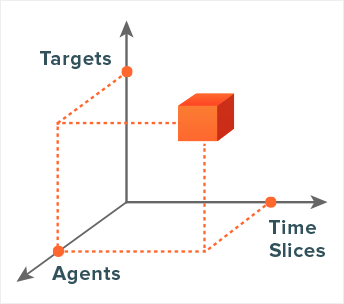
For X-Layer to work, data needs to be organized according to a certain model with pre-defined dimensions that define the context. The context structure depends on the layer, for example, for the web.httpServer layer the context is defined by:
- target (e.g. URL)
- agentId (identifies the agent)
- timeSlice (the instant in time where we collect data from the agent)
For agent-based periodic tests, each time slice contains exactly one measurement to the target from each agent. Each layer has a specific set of metrics associated with it, for example web.httpServer has availability, responseTime, fetchTime, e.g.
layer: (web.httpServer)
    |
    |-- context: (target, agentId, timeSlice)
          |
          |-- metrics: (responseTime)
You can think of each piece of context inside a layer as a data cube with different dimensions as indicated in Figure 1 below.
web.httpServer layerLayer Correlation
Context cubes in different layers can be correlated using correlation functions. Each ordered pair of layers has its own correlation function. For example between the network end-to-end metrics and BGP views, net.endToEnd → net.bgp:
net.endToEndhas contextC1=(host, agentId, timeSlice)net.bgphas contextC2=(bgpPrefix, routerId, timeSlice)- Correlation function in this case takes context
C1and produces contextC2such thatC2 = (longestPrefix(C1.host), * , C1.timeSlice)
Each pair of layers has a different correlation function that transforms the context of the first layer into the context of the second layer. The table below show the possible pairs of layers for which we currently have correlation functions, the first layer is the column on the left and the second layer is the row on top.
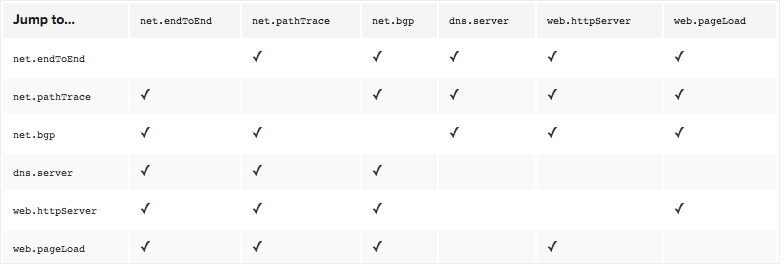
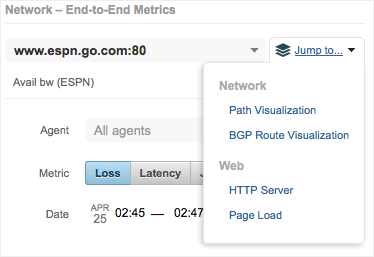
In the product, you can see the layers you can reach from each view in the “Jump to” dropdown (Figure 2). You have an example where the user is at the layer net.endToEnd and it has the options to jump to four other layers, also marked in blue in Table 1.
X-Layer in Action
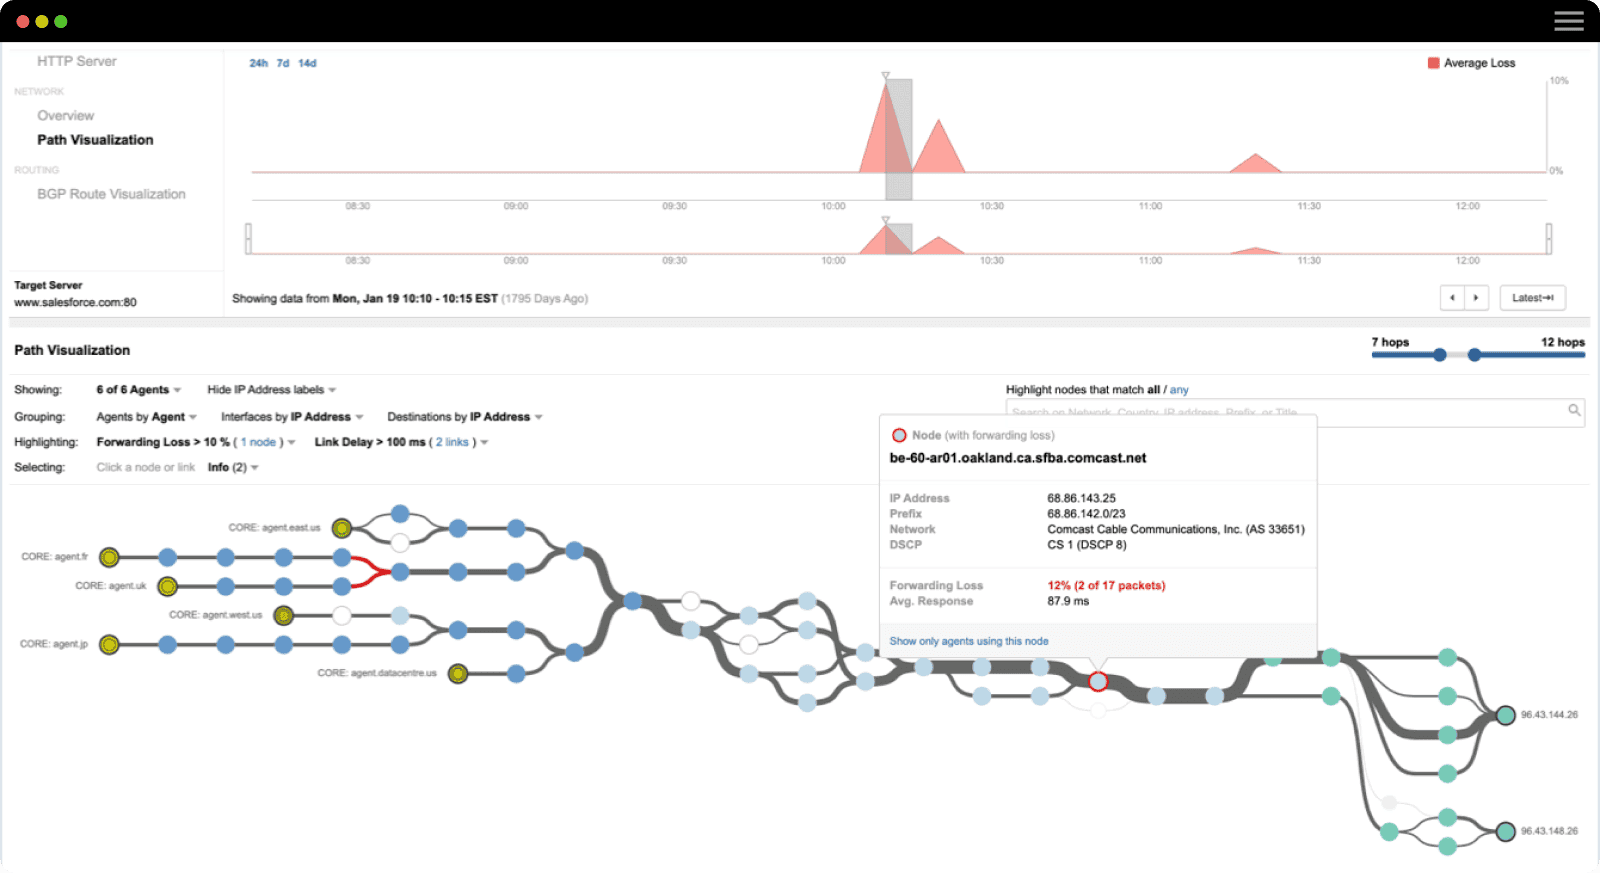
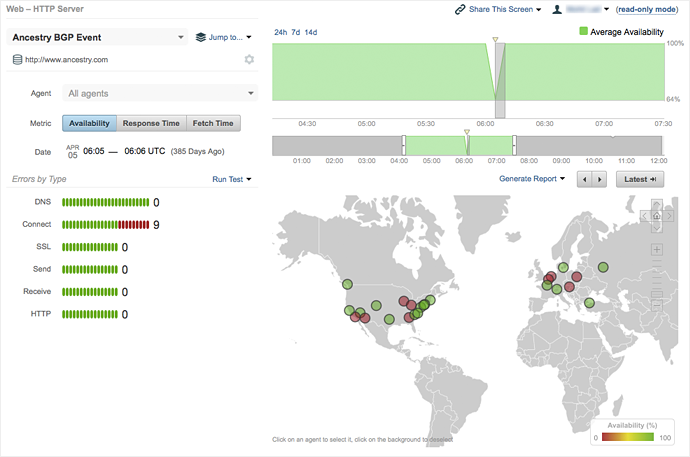
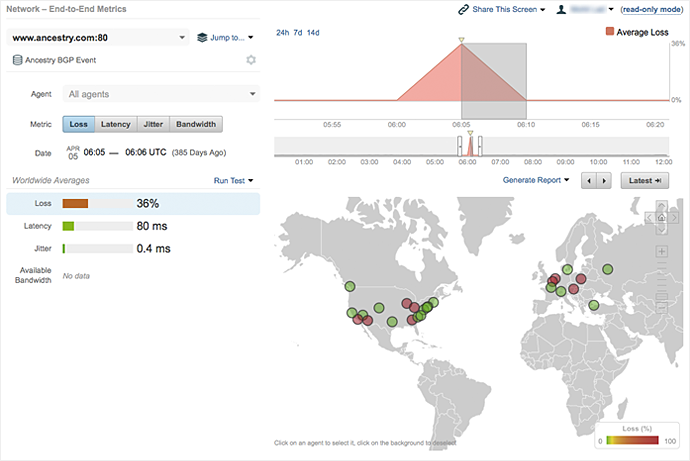
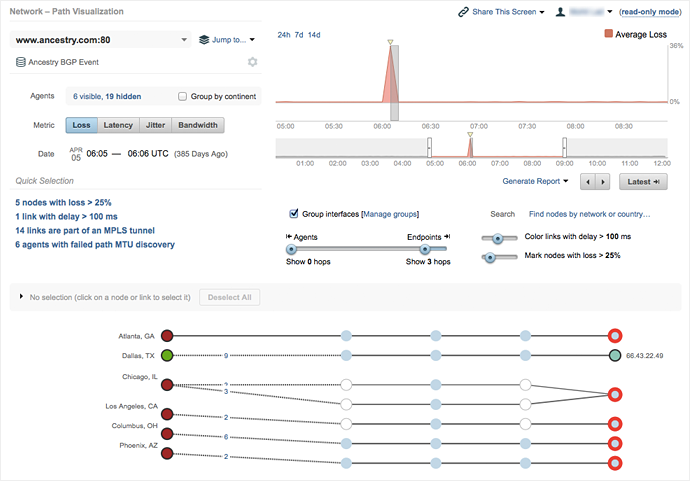
The following example shows how X-Layer can be used to find the root cause of an outage. Figure 3 shows the HTTP server availability from ThousandEyes agents when accessing www.ancestry.com. The figure shows a drop in availability associated with several errors (red agents) during the TCP connection phase, which is typically an indication of a problem at the network layer. We can use X-Layer here to jump to the “Network - End-to-end Metrics” (Figure 4), which by default shows the network packet loss to www.ancestry.com. The selected time shows a full round of tests across all the agents, and indicates an average packet loss of 36%. At this point, we can click on “Jump to” button to load the “Path Visualization” view in Figure 5 and determine which L3 hops/interfaces along the path are losing packets.
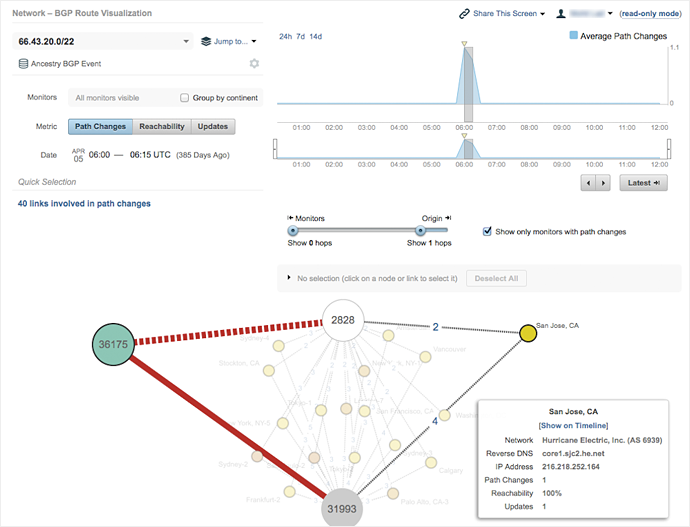
Figure 5 shows a loss pattern (red circles) that is pretty distributed across different paths, without having a single node or provider responsible for the terminating routes. This is typically a fingerprint of a routing change at the BGP level. In order to verify this, we use X-Layer capability again to jump to the control plane layer “BGP Route Visualization” (Figure 6). Figure 6 shows very clearly that there were a number of BGP AS path changes during the same time packet loss was happening, in particular in the figure, we can see the Hurricane Electric San Jose router undergoing a path change from AS2828 (XO Communications), to AS31993 (American Fiber), and this change is also visible from several other routers (the yellow circles).
In summary, we went from the web.httpServer layer in Figure 3 to the net.endToEnd layer in Figure 4, to the net.pathTrace view in Figure 5, to the net.bgp view in Figure 6, nailing down the root cause of the problem to a BGP routing change between the origin AS and one of the providers.
Putting It All in Context
You’re probably used to dealing with a variety of disconnected tools and data sets already, from ping to traceroute and dig. Sifting through the results, especially over time, and rebuilding a picture of what is going wrong can be incredibly frustrating.
X-Layer brings together information from a range of application delivery layers, including TCP connections, IP forwarding, routing and DNS and puts this information in context. For each service or application you care about, X-Layer records performance information over time and correlates it across data sources. Think of X-Layer as an instant replay, where you can view the performance of your network from a variety of angles so that you can make the correct troubleshooting call. Begin troubleshooting application delivery with X-Layer today by signing up for a free trial of ThousandEyes.
