In our first post on monitoring Zscaler secure web gateways (SWGs), we looked at the overall architecture of the Zscaler service and the monitoring implications for IT and network administrators. We also explored how to use ThousandEyes to solve a Salesforce performance issue using a monitoring approach that combines end-to-end HTTP testing through the Zscaler GRE tunnel, and network-layer testing to the Zscaler GRE tunnel endpoint and ZEN proxy server. In this post, we’ll walk through troubleshooting a real-world issue that we encountered with a ThousandEyes customer during their readiness assessment for deploying a cloud-based CRM system for their organization.
Understanding SaaS User Experience through Zscaler
Deploying a SWG like Zscaler is like extending your branch office network boundaries into the cloud to a data center (Zscaler ZEN) where your traffic is inspected for security threats. For the most part, this works amazingly well when you consider the physics involved, but there are times when issues arise. So, as with any new technology roll-out, it’s a good idea to plan for a readiness phase where you can see if there are any hiccups before you cut all your employee traffic over.
In this case, the customer wanted to understand the impact of a cloud-based inline secure proxy on Veeva, a CRM system for life sciences and pharmaceutical companies. In this case, we set up Enterprise Agents to monitor and compare user experience and network performance between their pre-Zscaler and Zscaler-based architecture over a six week period. Based on the Page Load, HTTP Server and Network layer tests provisioned on the two Enterprise Agents, we built a series of monitoring reports to provide insights.
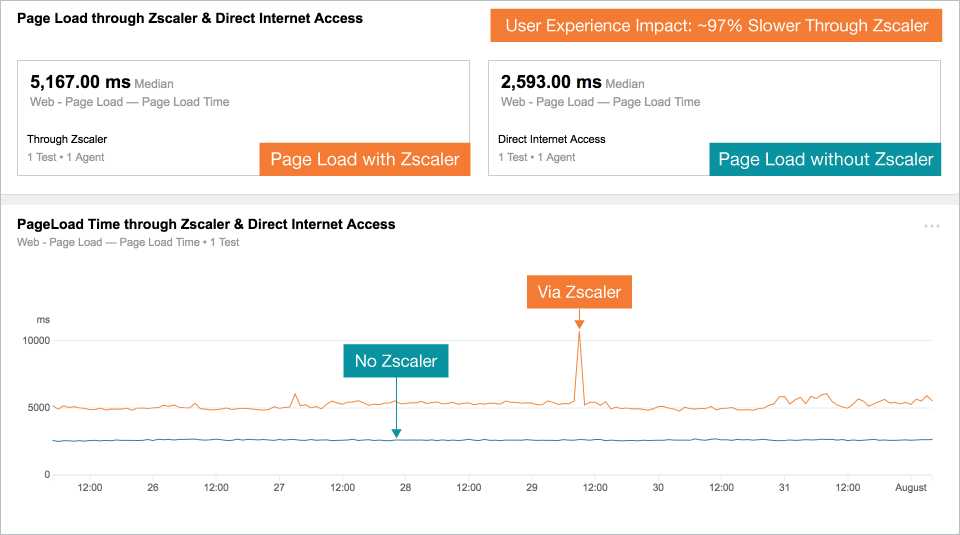
The first report that the customer looked at was a User Experience report that displays a comparison of Page Load test results conducted with and without Zscaler over a continuous 24 hour window. As we can see in Figure 1 below, inserting Zscaler into the data path significantly impacted the Veeva user experience, with Page Load times increasing by 97% from 2.5 seconds to almost 5 seconds.

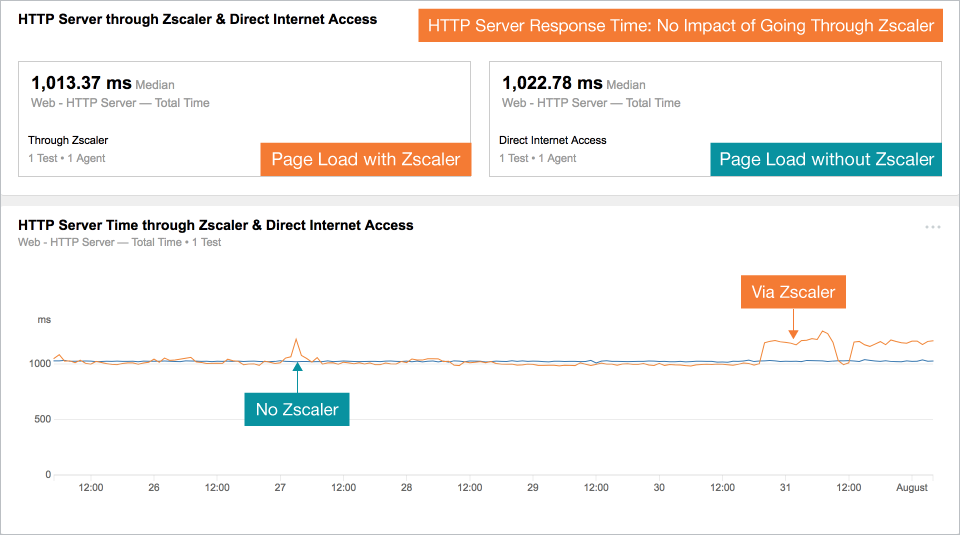
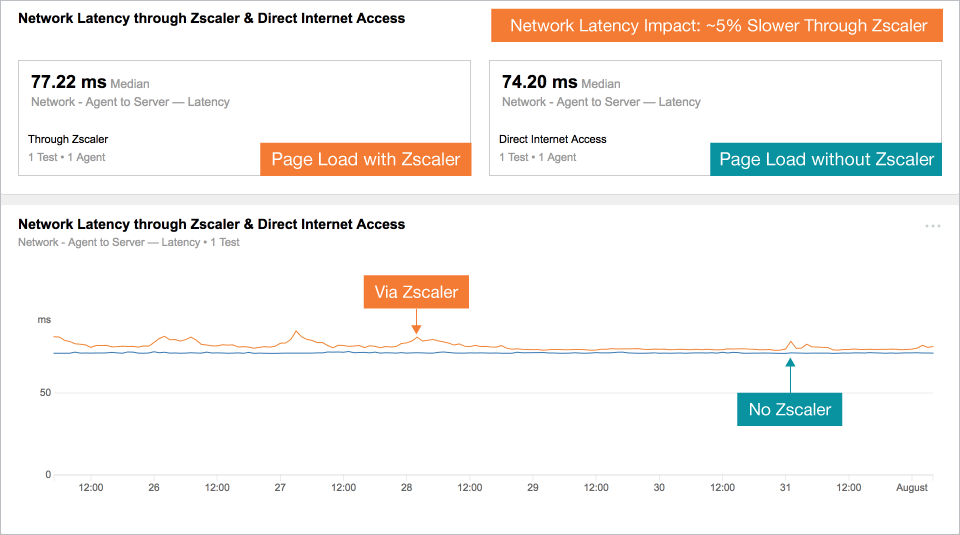
The question that arises is why this is occurring. To find the answer, we looked further down the stack at reports focused on HTTP Server and Network layer performance metrics. As we see below in Figures 2 and 3, there is no noticeable difference in either HTTP or Network layer performance metrics when comparing the Zscaler and Direct Internet Access test results.


Troubleshooting Inferences and Further Analysis
There were two main troubleshooting inferences drawn from the above set of test results. On a positive note, network connectivity through Zscaler was generally stable. When we observed spikes in HTTP Response Times, those spikes were traceable to concomitant spikes in network latency. The second was that the overall degradation in user experience was likely due to specific objects on the Veeva page that were taking longer to download due to the Zscaler security analysis.
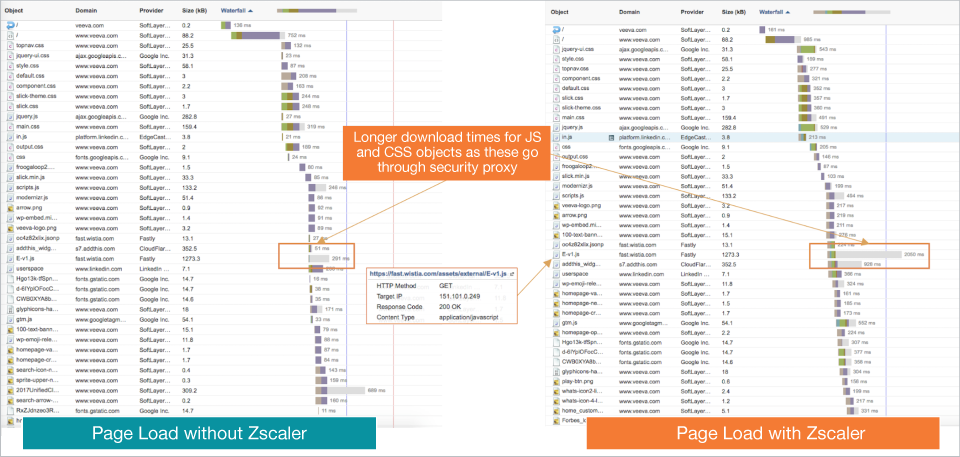
To further validate our inferences, we compared detailed Page Load waterfall diagrams for both Zscaler and Direct Internet Access paths. In Figure 4 below, we can see that an additional 2 seconds in download time has been added to the Zscaler Page Load time due to a single JavaScript file. Note that this JS file is hosted by Fastly, a CDN provider used by Veeva, which highlights the complex matrix of service delivery paths that SaaS providers leverage for delivering an optimal user experience.

By identifying the precise objects on the page that were causing the issue, the customer was able to employ real data and collaborate with both Zscaler and Veeva to resolve the issue. Overall, the availability of detailed analyses gave the project team the ability to fix issues in their readiness phase on a per site and per Zscaler ZEN basis. Embracing a lifecycle approach and adopting monitoring early in the readiness phase enabled the operations team to establish baselines, set proactive alerts, establish new troubleshooting processes, and collaborate with their cloud vendor ecosystem.
Key Takeaways
When rolling out Zscaler or another cloud-based secure web gateway, it is important to remember that you’re dealing with multiple internal and external dependencies, including DNS, ISPs, SWG and SaaS providers and your own network. Any of those could be the source of an issue, and the last thing you want to do is blame the wrong party. Measuring and benchmarking at multiple layers gives you the insights you need to isolate the problem domain and the data to get the right party to help you resolve the problem. If you’d like to learn more, download our white paper on monitoring cloud-based secure web gateways. If you’re ready to get started, request a demo.