In a word, experience. Allow me to explain.
AIOps is a hot, new buzzword that encapsulates the hopes and fears of all the years of underperforming IT monitoring and seeks to deliver a better answer. There’s a lot of understandable skepticism when invoking “AI” in any definition today, so I thought that it would be interesting at the outset of 2019 to explore this topic and offer the ThousandEyes perspective.
A Disclaimer
ThousandEyes is not an AIOps vendor, and we’re not interested in AI-washing our solution. So we don’t have a dog in the race for “who is the best AIOps solution.” However, we are interested in helping customers realize value from visibility. So my goal in writing this post is to tease substantive meanings apart from gauzy illusions around this latest hotness, so you don’t end up in a hot mess due to unclear expectations around deploying “yet another tool” in search of monitoring bliss.
What Is AIOps?
Gartner doesn’t have an official definition for “AIOps,” but rather for “AIOps platforms.” More on that distinction later. This blog by Gartner’s Colin Fletcher is well worth a read. However, if we extrapolate from their platform definition, AIOps can be defined as the use of big data, modern machine learning and other advanced analytics technologies to directly, and indirectly, enhance IT operations (monitoring, automation and service desk) functions with proactive, personal and dynamic insight. AIOps involves the concurrent use of multiple data sources, data collection methods, analytical (real-time and deep) technologies, and presentation technologies.
If I were to try to vernacularize that definition, I’d say that AIOps attempts to unify insights from multiple big data monitoring streams.
Tool Bloat Is a Big Problem AIOps Solves, But It Isn’t the Point
Everyone in IT operations knows about tool bloat. Countless studies have been done about the effects of piling on too many monitoring tools. Essentially, more tools add up to less effectiveness and poorer outcomes. Why is tool bloat so common? Well, let’s be fair to all the engineers who have bought these tools. There is usually a reasonably distinct data set that each chosen tool can uniquely get at, which theoretically should enhance rather than reduce operational visibility and action. The problem is the lack of ability to correlate the signals that all these data streams provide and turn them into clear problem diagnoses and follow-on actions.

But just to double-click for a moment, why is a lack of correlation so problematic? The reason is that IT no longer lives in a monolithic world. Once upon a time, a single monolithic software application ran on a single, physical server connected by a physical interface to a network that led through switches from a data center to the WAN and via a virtual circuit to a branch office router, etc. Correlation was an architectural assumption. If the server interface to the network had an issue, the application had an issue. Ahh, the naive simplicity! It reminds me of that old song ‘Dem Bones, where human anatomy is reduced to “the leg bone is connected to the hip bone.” In those days, correlation could be accomplished by a “Manager of Managers” (MoM) approach, where you had network, server, application monitoring stacks that then bubbled up to the MoM where you could tie those domain data sets. They’d receive the alarms from all the other tools you owned, typically worked on pre-defined “cookbooks” of various sorts to interpret those multiple signals and correlate those signals, tie together data about head and neck bones (app) to shoulder and backbones (server), down to hip, leg and foot bones (network).

But clearly, that monolithic era is long since passed. Application disaggregation, the evolution to virtualized and containerized infrastructure, overlay and underlay networks, the ubiquity of cloud and SaaS-based service components communicating over the Internet in nearly every application, network and infrastructure means that correlation is devilishly difficult yet still critically important.
That’s where AIOps is defined as the solution: using advanced analytics to consume various streams of monitoring data and do the correlation that humans can’t do via swivel-chair analysis. AIOps brings Big Data capacities to handle massive streams of data and either store or manipulate multi-dimensional data sets in real time, plus advanced analytics/ML/AI to the mix to improve on correlation. These technologies are powerful and do bring real promise. But remember that that power and promise doesn’t come for free. Machine Learning requires learning, so who is the trainer? The answer is that you or someone on your team will need to be, and it may take many months to teach ML something truly beneficial.
Do You Have Experience?
Or maybe the question is, do you get experience? If we want to understand the IT Ops visibility problem more deeply than just describing a key symptom—namely tool bloat, then we need to realize what IT Ops visibility has been suffering from. In the words of a Gartner analyst I recently spoke with, IT monitoring is trying to recover from “two decades of obsession with anomaly detection on siloed data.” Where does this obsession coming from? I’d venture to say it comes from being isolated from concern about the end-user experience (EUE) and instead adopting a defensive position around siloed measures of success and proof of innocence. If the Ops monitoring tool says it’s green, then don’t go blaming us—we’ve got proof that the servers/network/WAN is doing its job. Or if the Ops monitoring tool says things are red, scramble and solve that problem, whether it has a real impact on user experience, application performance and availability or not.
But the fact of the matter is that IT Ops now lives in an experience-driven reality. In a digitized business, the customer experience is at the center because all digital experience is meant to be monetized through improved revenue or employee engagement and productivity. Digital transformation relies on a move to the cloud to gain greater agility, but the move to the cloud strips away a large portion of IT’s role as acquirer, integrator and operational owner of all the IT stuff. Today, applications are increasingly constructed out of a multitude of internally-developed services plus a myriad of external services. More and more of those services run in the cloud. All those services communicate over a vast array of networks, most of which are part of the Internet and aren’t under any direct IT control or direct vendor governance. Customers and employees access these apps via the same plethora of mostly external networks.

Application teams have been on the vanguard of looking at end user experience (EUE), and this has driven the adoption of Application Performance Monitoring (APM) tools, whereby for example you can inject monitoring code that will give the developer feedback on key performance indicators of user experience.
Beyond technology, IT teams have tried to unify the motivators and workflows across appdev, IT and network Ops through DevOps culture, continuous process and newly defined roles like Site Reliability Engineering (SREs).
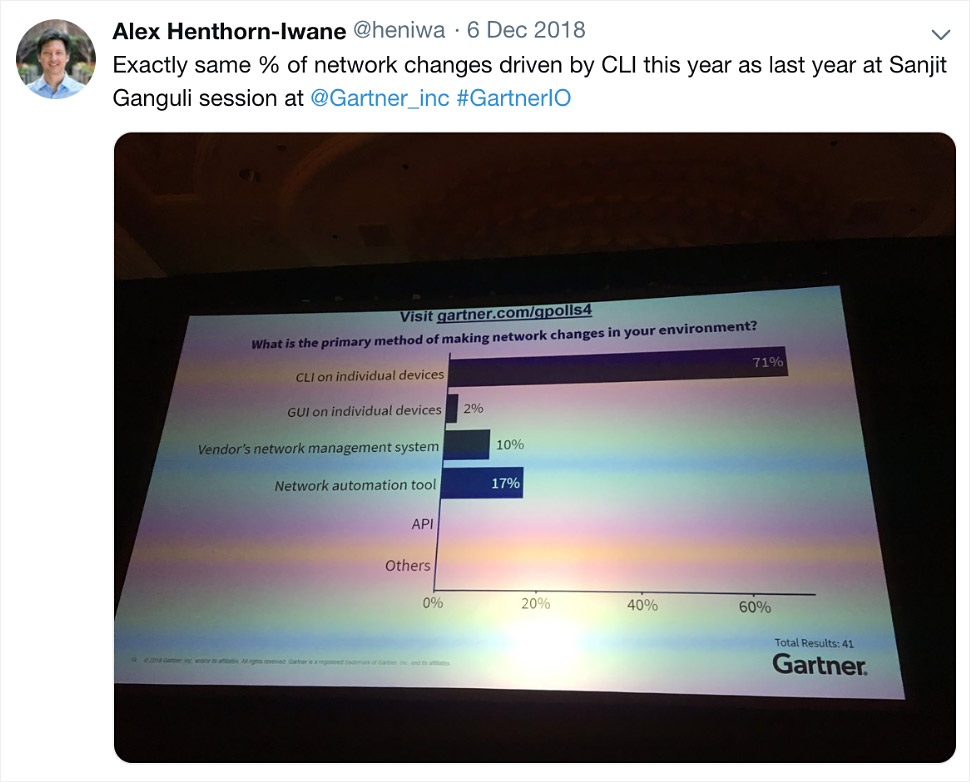
Yet many IT Ops teams are still adapting to this new reality. Perhaps most infamously, network teams have struggled to make the transition to focusing on user experience. Now to be fair, enterprise networks are more complicated to manage than fleets of servers, because they’re semi-arbitrary topologies run by autonomous, intelligent routing control planes that depend on complex layers of network functionality and very difficult to understand human configuration inputs. At the recent Gartner IOCS conference, an ‘informal’ audience poll taken on the use of CLI-based network configuration versus network automation, yielded the somewhat discouraging insight that the enterprise IT teams present were not ready to progress much past where they’ve been for the past several years.

That said, there is a strong movement towards NetDevOps, where automation takes a much more significant role. And SD-WANs are bringing centralized orchestration into network topologies (Interested in learning more about SD-WANs? Read our article on the benefits and limitations of SD-WANs). But siloed, red-light/green-light management plus highly manual network troubleshooting analysis is still exceedingly common today. And too little of it is connected to the app and user experience.
Next Up: Solving the Visibility Gaps that AIOps Leaves
AIOps is a powerful technology, but it doesn’t solve every problem and by itself can’t make up for significant gaps in visibility data. With the move to delivering experience increasingly over the Internet, the visibility data gap becomes more like an abyss. In our next post, we’ll look at that data gap, two options for processing all your experience and underlying visibility data, and how we approached the problem. If you’re ready to learn more about Network Intelligence from ThousandEyes, download the 2018 Network Intelligence Planning Guide.