We’ve been busy this summer (a rather warm one in London and a cool one in San Francisco) to bring you exciting new ways to get better intelligence about your networks and applications. Highlights include:
- Path Visualization and Device Layer get grouping options to elegantly summarize your data.
- Multi-cloud gets easier with Cloud Agents in Amazon AWS, Microsoft Azure and Google Cloud Platform.
- Building off of a launch of broadband Cloud Agents in Q1, we welcome AT&T as a broadband choice as well as additional new locations.
- Managing reports, devices and agents is easier with filters and bulk actions.
- Stay in the loop with our new ServiceNow integration and download your reports as PDFs.
Read on for the details and how you can put them to use!
Answers now just a (single) click away
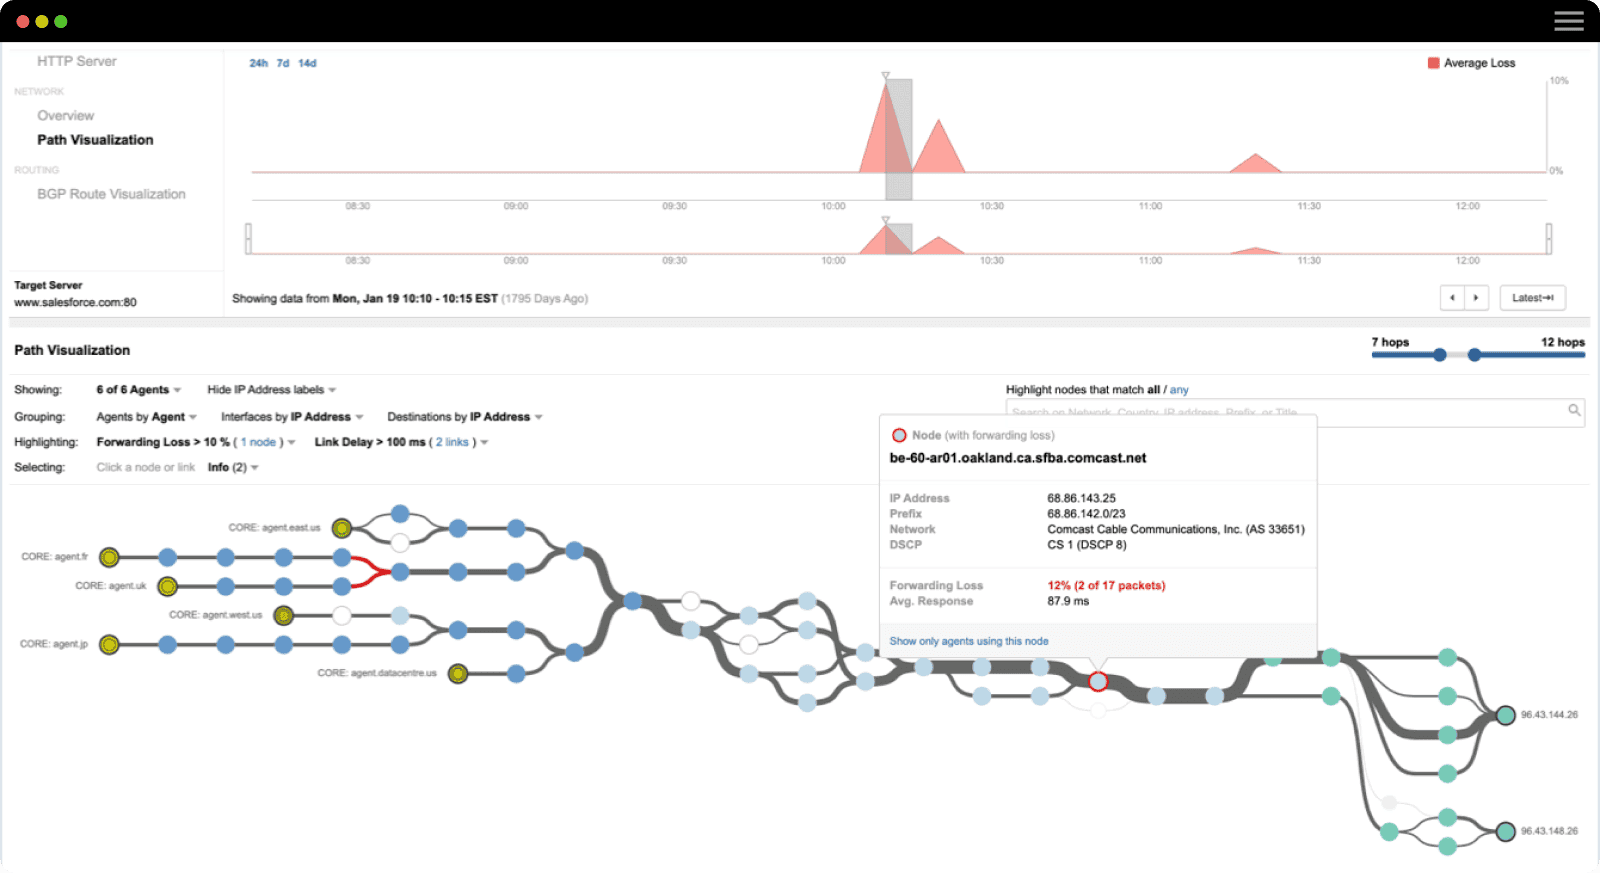
Ever needed to explain to your boss how a service gets delivered from point A to point B? Or had to map out how packets move around your network? Hopefully, our Path Visualization has been of assistance; you see all of the responsible interfaces laid out in detail. But it’s a lot of detail; we think we can do it one better.
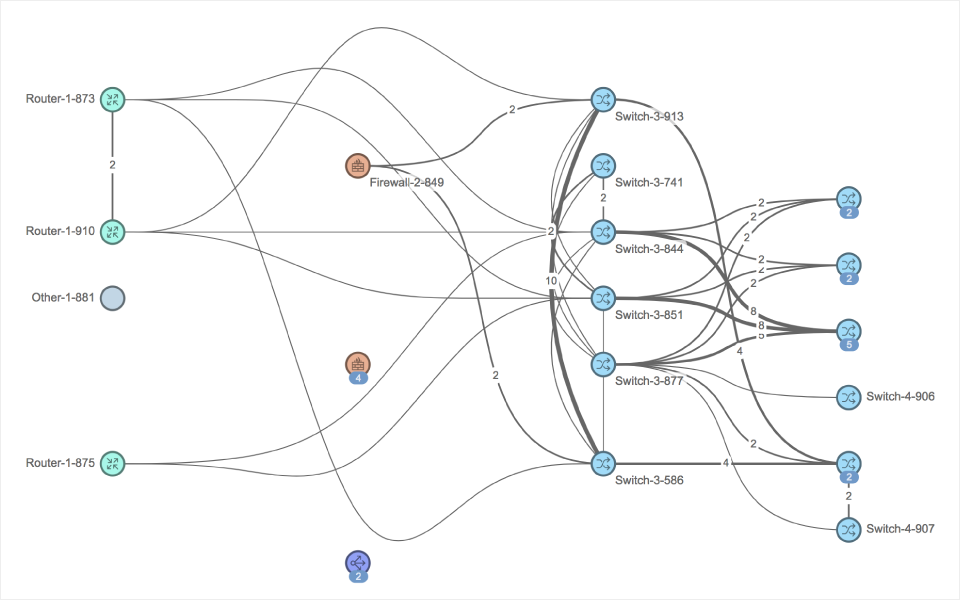
Now you can easily show the paths that your traffic takes between data centers, branches and remote Internet endpoints with Path Visualization Grouping. Even find anycast IPs that belong to multiple cities or geographies. Choose group Interfaces by Location or Network and, voila, your paths are neatly summarized for even the most network-averse of CIOs to understand. Showcase how your services are connected to the Internet, or how an ISP’s problematic POP impacted your performance.
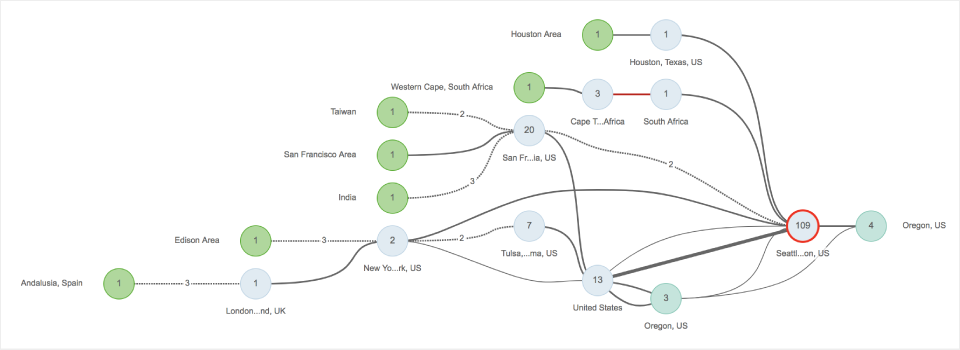
And not to be left out, Device Layer also gets grouping and click to drill down topologies. Rather than retrieving that perpetually out-of-date print out of your data center network, pull up Device Layer and click away in real time.
Multi-Cloud Magic
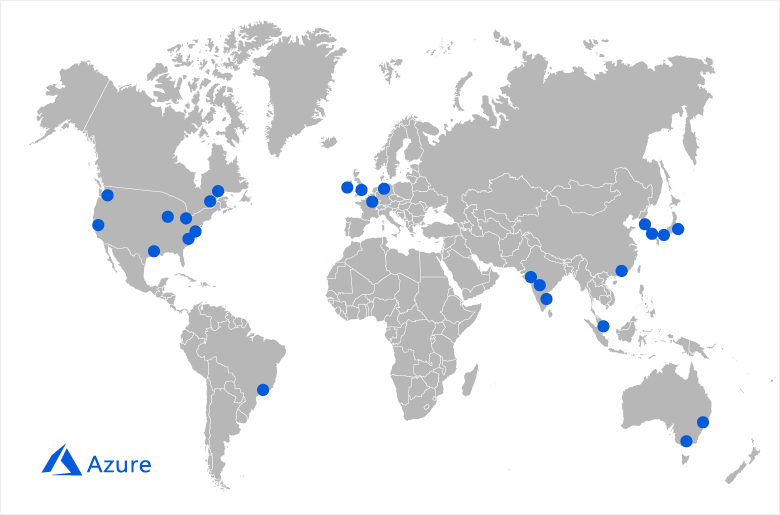
In June, we announced new multi-cloud monitoring that supports the popular IaaS clouds from AWS, GCP and Azure. Benchmark performance between regions. Monitor connections to hybrid environments. And keep tabs on key partner services hosted in these providers.
In addition to the AWS and GCP regions we launched back in April, you now have 25 Microsoft Azure regions to monitor from as well as the latest GCP regions in Finland and Los Angeles. Benchmark performance, track cloud outages and map out your IaaS environment.
Choose Your ISP
Over the first half of 2018 we’ve been rolling out new options for Cloud Agents where you can specify which carrier you want to monitor from. You can now select AT&T as a vantage point across major US metro areas, in addition to CenturyLink, Charter, Comcast, Cox and Verizon.
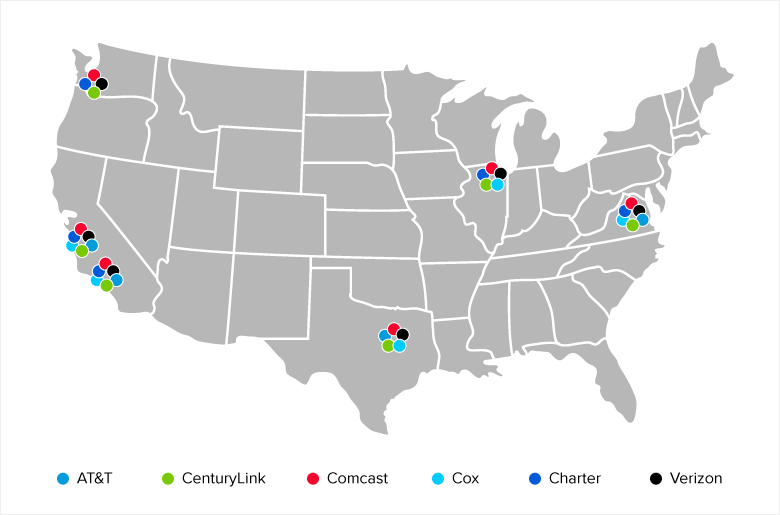
In addition, we’ve added Cloud Agents to ISPs in Tokyo (now choose from KDDI or NTT) and we’ve expanded Cloud Agents to hosting locations in Mexico City and Takamatsu, Japan.
Ease of Management
As our customers grow with ThousandEyes, they monitor more of their services and infrastructure. And with more monitoring comes more administration, which no one loves. We want to ease that burden. Over the past few months (and in the next few) you’ll see each of our settings views provide you the ability to filter on the fly and take action with a click.
Want to apply an alert to all of your Juniper switches? Check the health of all of your agents in Japan? You’ve got it. No more quick and dirty API scripts needed.
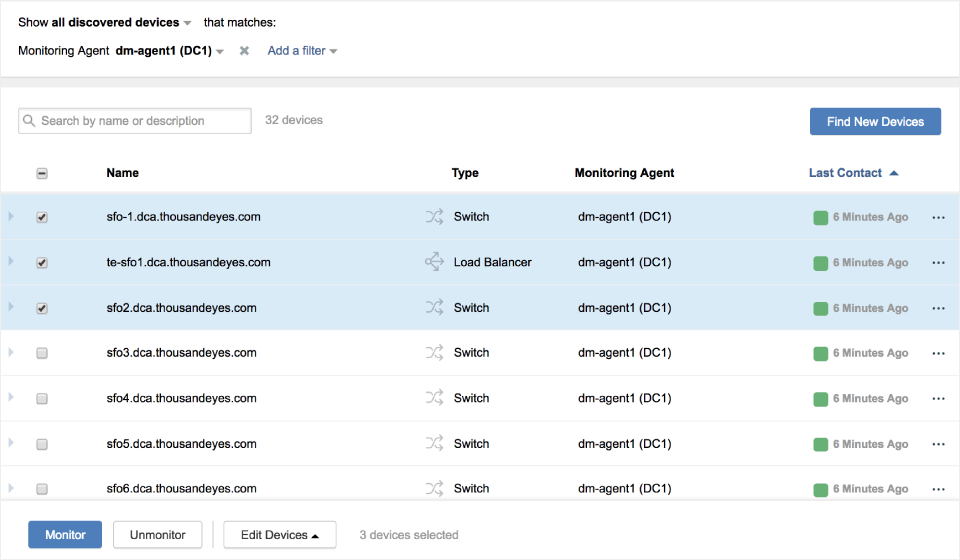
Device settings and Reports settings now have multi-select filters to drill down and bulk actions to get immediate gratification. Enterprise Agents also have filters, with bulk actions coming (very) soon.
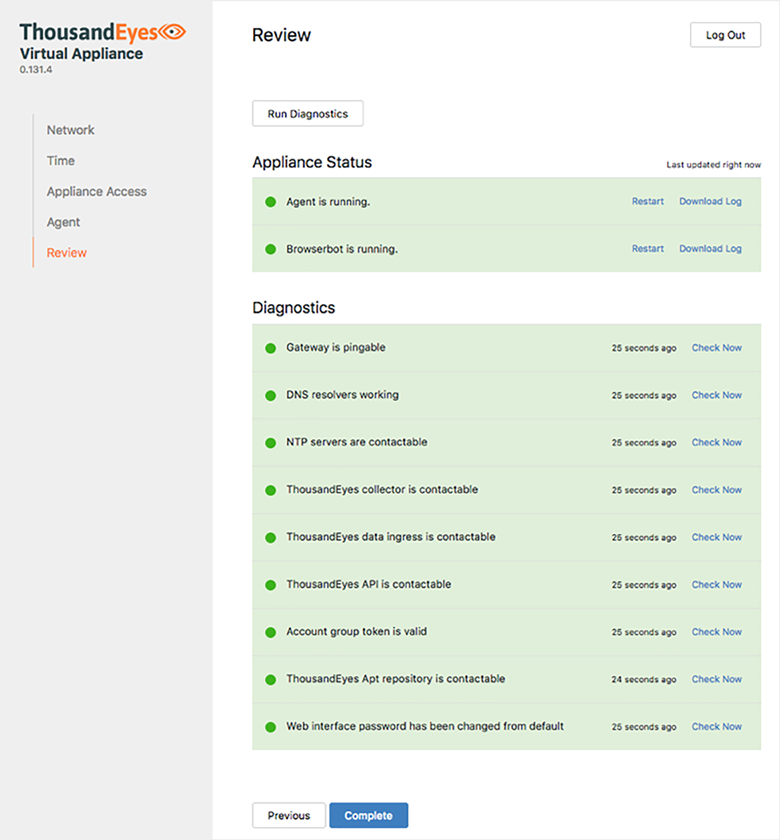
And our Enterprise Agent Virtual Appliance has a new look and feel, complete with an improved diagnostics check so that you can verify if your Agent is up and running right away!
Plays Nice with Your Workflows, Fits into Your Day
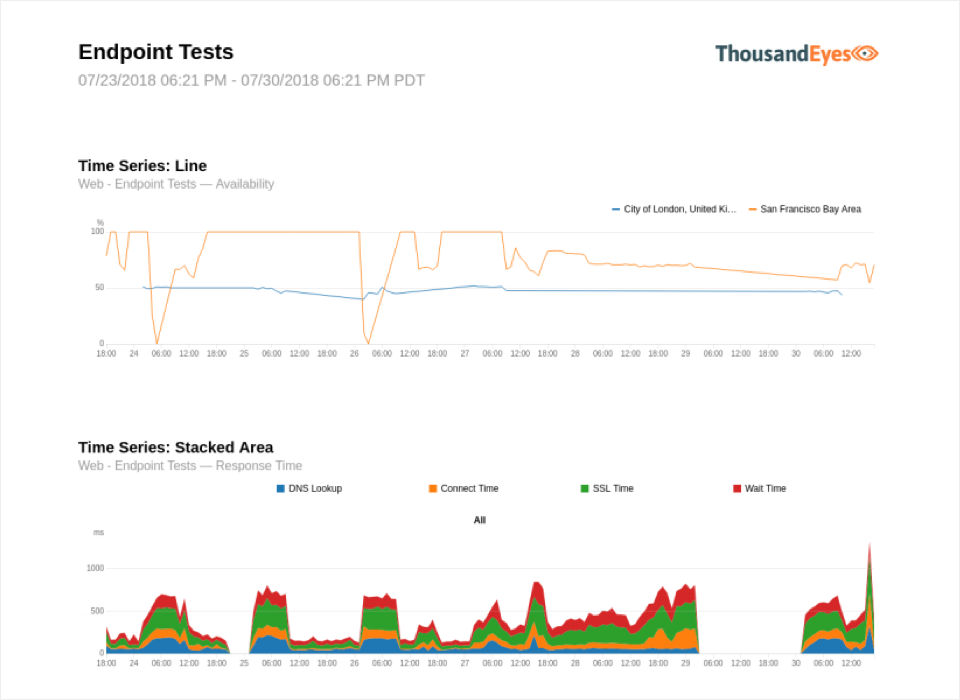
You’ve developed the perfect report to benchmark performance, showcase your SLA goals or dig into a post-mortem. Now you need to share it. We now offer a third way to share your reports, joining our existing share links and embedded widgets. You can now download reports as a PDF so you can attach it to an email or store it for safekeeping.
We’ve also been working on new integrations to join Slack and PagerDuty. Our newest is ServiceNow, with an integration into the Incident Management service. In addition, you can secure your Webhooks integrations with new token and OAuth-based authentication. Alert away!
We’ve got a lot more in store for you this year. Subscribe to our release notes for updates every two weeks; you can sign up from the Customer Success Center profile page. And stay tuned for more exciting additions here on the blog!
