Today’s Digital Ecosystem
The digital services we use today can best be described as an ecosystem that is constantly growing in capabilities and complexity. An ecosystem is essentially a framework of multiple individual systems. And like any multi-system framework, the components of a business application rely on several independent systems, each governed by its own mechanisms and rules, yet needing to interact with and engage other systems.
Any hiccup in any one of these systems can result in a poor user experience. A half-second of extra processing time, 1% packet loss at some transit node in the path, or many other seemingly miniscule measurements can be catastrophic. This presents a challenge for IT teams, who are being asked to monitor a collection of independent yet interconnected things.
When gardening, we deal with similar conceptual challenges, albeit composed of different mechanisms: the mycorrhizal network, soil nutrients, sunlight, water, and various biotic and abiotic conditions all play a role in healthy plants. Digital services operate in a similarly interconnected and dependent fashion, with each component of this digital ecosystem playing a critical role in the overall user experience.
Monitoring an Ecosystem
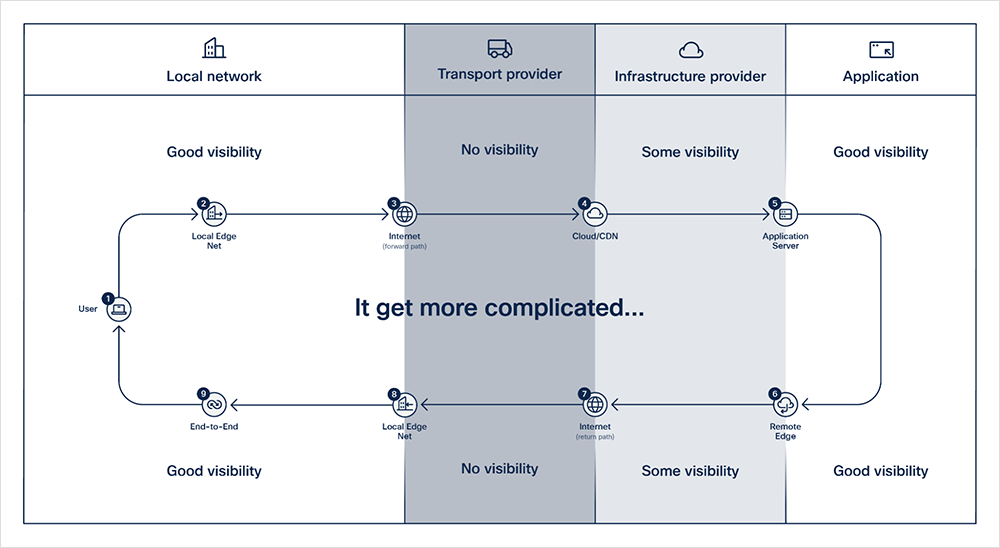
When assessing the performance, reliability, or productivity of an ecosystem, it can be unwieldy without first stepping back and breaking the whole into the various components, each of which will be gauged independently. Let’s take a typical application flow—this flow shown in Figure 1, when drawn, conveys the idea of a circle or a loop, and it truly is. Applications require two-way communication and, in today’s world, will almost certainly cross multiple physical and logical domains.
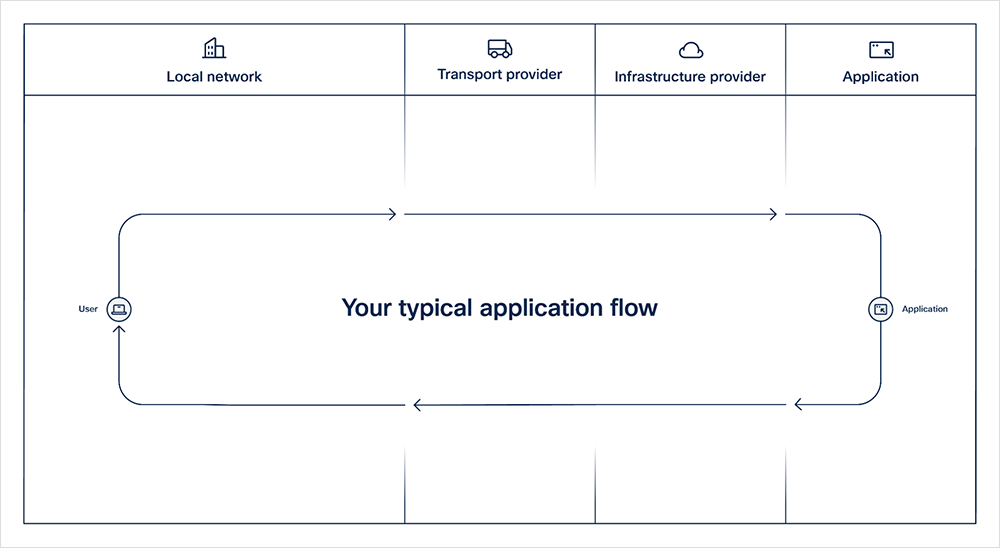
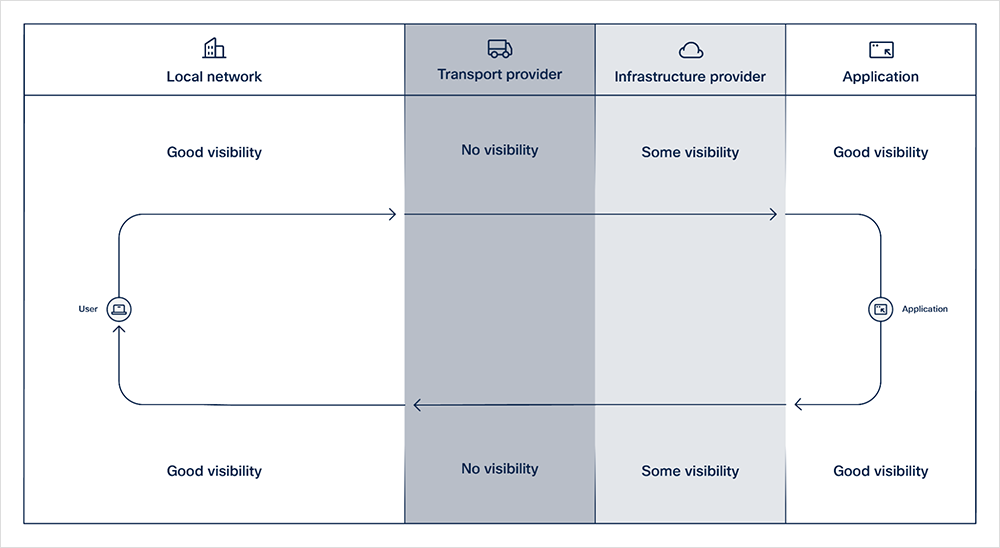
With some of these domains, there will be plenty of visibility. There will be rich and numerous metrics, and administrative access to the gear. Other domains, such as public cloud infrastructure or CDNs, offer some visibility but markedly less than that within one’s own network or data center. And then others, such as the Internet, are a black box.
The diagram in Figure 2 below illustrates a campus or enterprise user’s access to an application controlled by the same enterprise, whether on-prem or cloud-hosted, and highlights the varying amounts of access to the equipment. In this scenario, there is access to the infrastructure and software at both the source network and at the application target, with one or more middlemen handling some aspect of the delivery. This is the best-case scenario. Third-party and SaaS applications reduce this visibility considerably at the target side. Some SaaS solutions offer visibility delivered to authenticated customers through proprietary web tools or their APIs, while others provide little to none.
Binary decision trees make up the flow of performance investigations, as shown in the mental investigative flowchart in Figure 3.
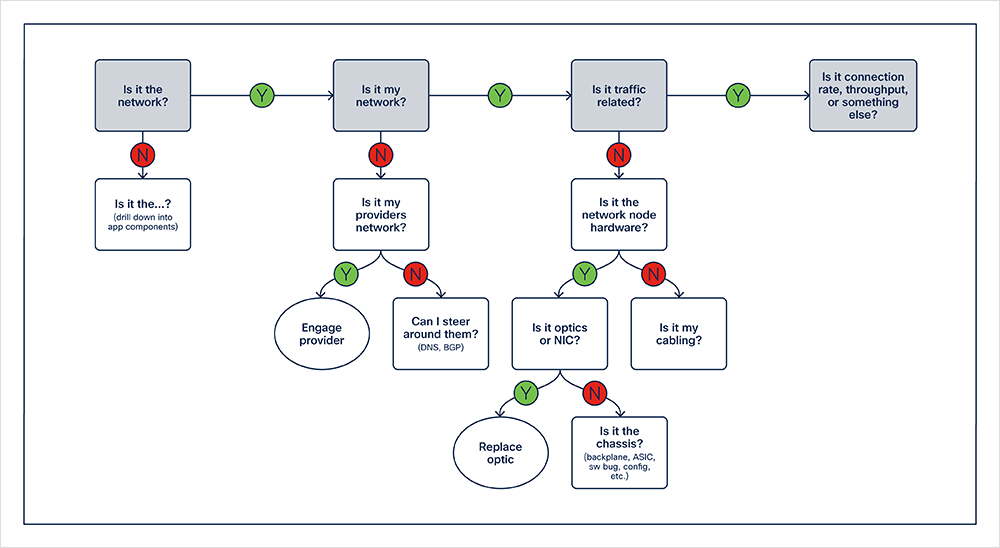
At each of these decision points, there can be significant delay due to data collection, analysis, correlation, and related tasks. Fault isolation, and knowing who is responsible for that fault domain, is the primary goal of any initial performance investigation.
Fault isolation helps us to identify the performance bottleneck and to know:
-
Which system?
-
What component?
-
Which location?
From there, we know who to engage to help with the necessary investigation, workaround, and resolution. The subsequent investigation ideally helps to fully understand the trigger and the resulting behavior. And this also tells us: Is it the network? Or, is it the application? Or even, is it a reliant service such as DNS, SSL, or some other third-party service?
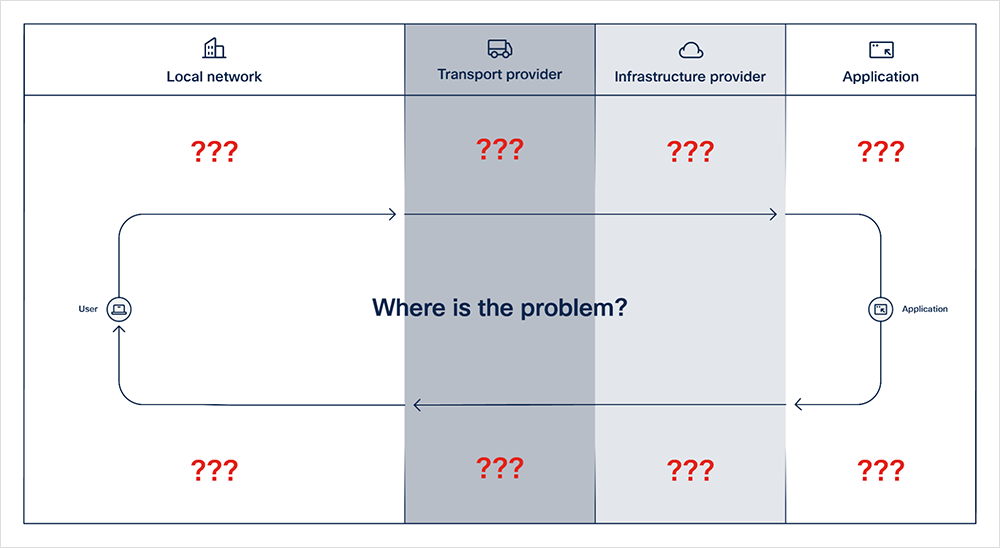
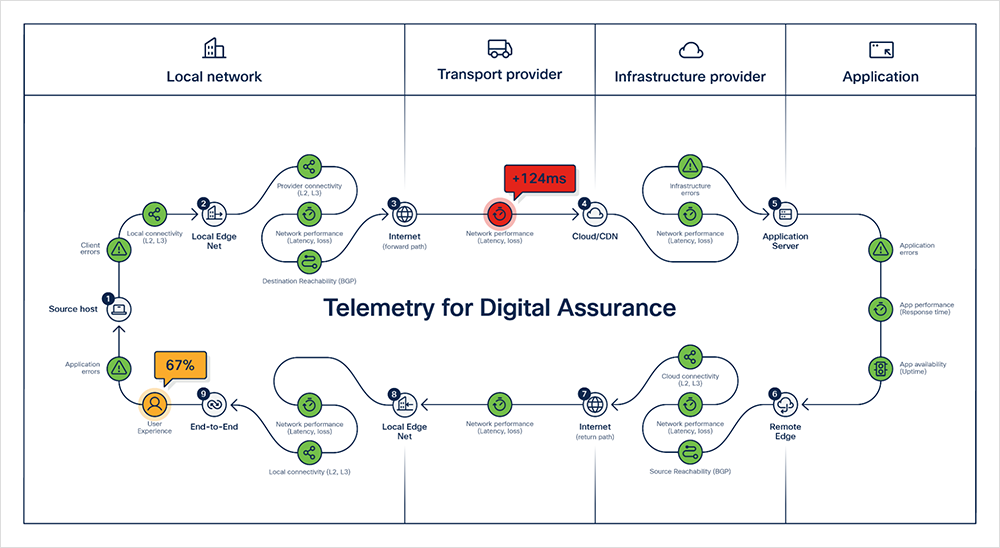
Digital assurance relies on the plentiful telemetry offered by the operational and architectural protocols, devices, and software that run today’s Internet, cloud, and applications. At each step in our application flow, various operations happen that can be measured and recorded, baselined, and correlated against not only individual process watermarks but also expectations of the end-to-end responsiveness of the application from a user perspective. There are many critical areas from which valuable performance insights can be gleaned, as illustrated in Figure 5 below.
From the moment the client launches a DNS query up through the application responses, there are numerous points in this flow, each with measurable signals, that can be gathered and analyzed to quickly isolate performance bottlenecks. This collective, contextual telemetry, if gathered and assembled in a meaningful and intelligent manner, can provide a near real-time, end-to-end performance view of the digital service or application.
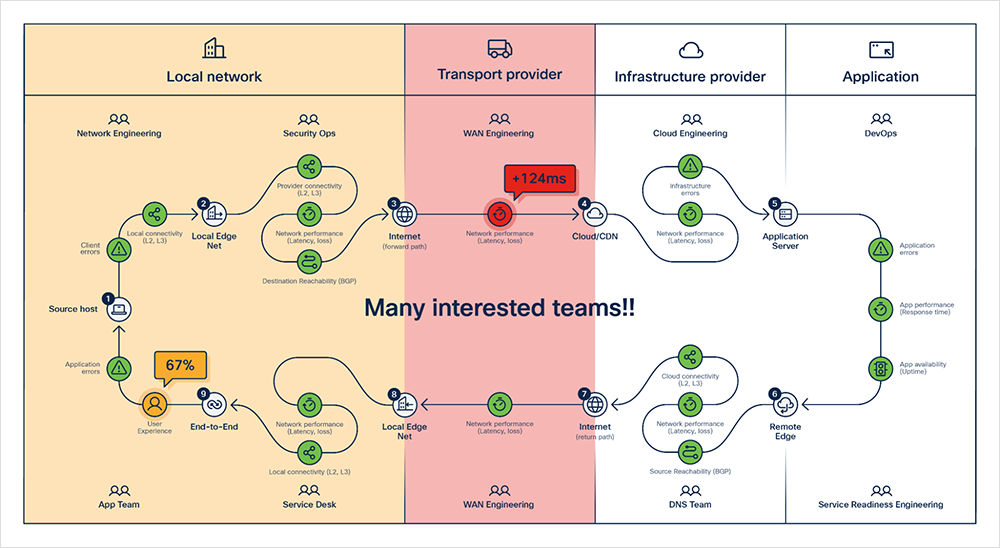
Network teams work diligently on delivering the network services as expected. Many other teams are involved in delivering the tasks and services needed to assure that the digital service is performing per expectations. While these two core objectives are distinct and separate, they intersect in many use cases, such as digital performance investigations and in each team’s knowing that the part they play in the end-to-end performance is healthy.
An IT team must know if any of these possibilities are happening at any given time:
-
There is a mis-performing infrastructure and no user-observed problems with digital services (e.g., infrastructure does not meet SLAs, but there are no user-observed problems).
-
There are user-observed problems with digital services, and a well-performing infrastructure (e.g., my infrastructure meets all SLAs, yet users are observing problems).
-
There are user-observed problems caused by mis-performing infrastructure (e.g., my infrastructure does not meet SLAs, and there are user-observed problems).
Each of these three requires its own mechanisms and processes for detection and resolution.
Digital Assurance for IT teams
Delivering well-performing digital services to users encompasses knowing that they are well-performing from the technical perspective as well as from the user perspective—these are separate things. On one side, you may have all gears spinning perfectly, without errors, but a third party or a transit provider or any number of other external dependencies could be introducing some issue.
Digital assurance stitches these ideas together and maps them to every IT team’s goals, which are to:
-
Assure that the digital service provided to users performs per expectations.
-
Assure that the infrastructure that you built, configured, controlled, and/or manage delivers its service objectives and is performing according to expectations.
-
Assure that third-party services and external infrastructure deliver their service objectives per your expectations.
Assurance is designed to address all three of these requirements, helping to enable IT teams to see, understand, and, ultimately, assure the experience of every user connecting to every application, over every network.