
As governments around the world struggle to adapt to the rapidly evolving environment surrounding COVID-19, businesses are dealing with the new reality of an almost entirely remote workforce. This leads to significant challenges across the board, including dealing with lowered employee engagement, morale, and productivity, along with huge pressure on IT organizations to support users remotely with different work stations and home Internet quality.
Here at ThousandEyes, we are committed to helping our customers handle this new normal of remote teams and ensure their IT organizations are well equipped to tackle any challenges in their way. As discussed by my colleague Alex in this blog post, ThousandEyes has decided to extend our expertise to aid organizations affected by the coronavirus. We’re offering free usage of our user experience agents until July 31, 2020, for identifying network and app performance issues for remote workers connecting to critical apps and services. If this is of interest to you, reach out soon — enrollment for this offer ends on June 30, 2020.
I am here to provide best practices to create a “Remote Workforce” dashboard that will allow you to identify and quickly troubleshoot any problems your team members are facing in their new remote working environments. We are using this exact dashboard in our internal ThousandEyes environment. In order to make it easier for you to create this dashboard, we’ve included our API JSON template at the bottom of this blog post that effectively represents a template for the dashboard above and allows you to populate your own remote worker data. You can also leverage our professional services team to help you build this dashboard for you. But first, let’s talk about the insights you can gather using this dashboard.
Troubleshooting Problems for Your Remote Employees
As ThousandEyes copes with becoming a remote-only organization, we’ve been leveraging our Endpoint Agents to gather data from employee laptops to better understand individual and regional scenarios. Each employee at ThousandEyes has an Endpoint Agent installed through IT and as employees have begun to work from home, our “Remote Workforce” dashboard has been helpful to surface problems that users may be having.
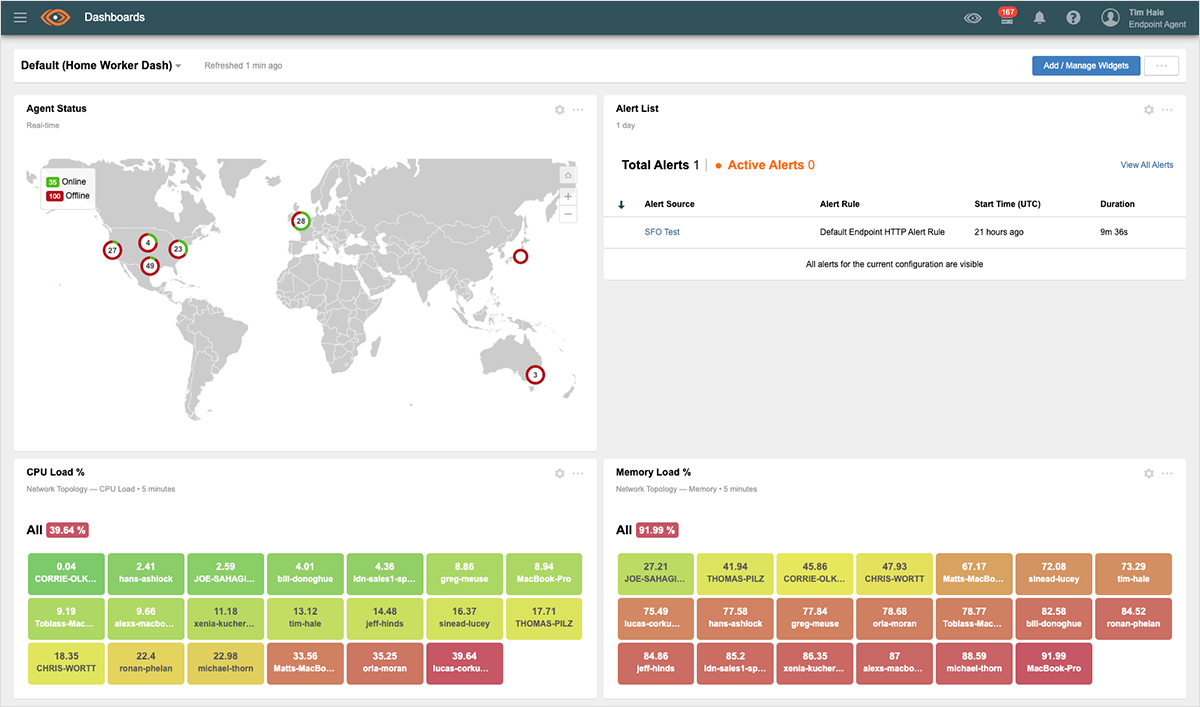
Here are some of the questions we are trying to answer using this dashboard:
- Is a particular application or domain causing users issues?
- What regions do I need to focus my efforts on?
- What specific users are having issues that I need to address?
- What specific issues are my users experiencing and why?
- What is my employee SaaS experience score per region?
- What are my top 10 users with bad Wifi signal quality?
- What are the top 10 slowest applications for each region?
Setting up this ThousandEyes “Remote Workforce” dashboard in your NOC environment can help save you significant time in identifying and troubleshooting issues as they occur in real time. It will also help you keep a pulse on your workforce and focus your attention on users, applications, or websites that are causing significant problems for employee productivity.
Building Your Own “Remote Workforce” Dashboard
This section will walk you through how to build your very own “Remote Workforce” dashboard. Remember, the API JSON template for this dashboard can be found at the bottom of this post. You can check out our developer references for more information on our API.
- Endpoint Agent Status
Description: This widget allows you to see the status of each endpoint in your environment. It will give you a quick overview, globally, of which endpoint devices are in use (Online), which devices are not in use (Offline), and which devices have disabled the Endpoint Agent (Disabled).
Setup: Select the “Agent Status” widget and select “Endpoint Agents” during configuration. No filter is necessary. - Alert List
Description: The Alert List widget displays alerts that are currently active or were active within the configured period of time. This will draw immediate attention to any issues your users are experiencing. Pro tip: Only set alerts based off of scheduled endpoint tests. You can also tie CPU/Memory alerts to alerts around experience score to provide some correlation of issues.
Setup: Select the “Alert List” widget and under Alert Type, select the “Endpoint Agents” type. Limit the display of alerts to whatever you feel comfortable with. We recommend 10, and you can always expand to see more alerts. Then select your desired time range of identifying active alerts. - Live Experience Score by Domain
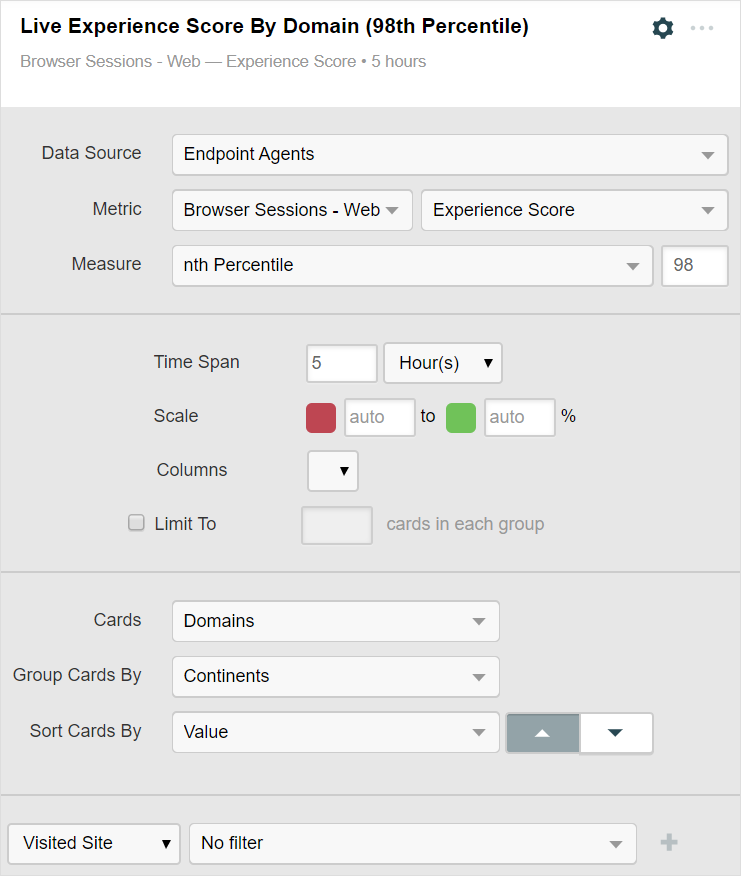
Description: This widget allows you to understand your employees’ digital experience (Experience Score) per website or domain they visit. It will also break out this experience by region so you can focus your attention geographically as necessary.
Setup: Select the “Color Grid” widget and follow the settings below. Feel free to adjust the “Measure” by which you view this data. Here we are showing the experience for the 98th percentile of users. However, you may want to focus on the mean experience or the users with the worst experience. - Live Response Time by Domain
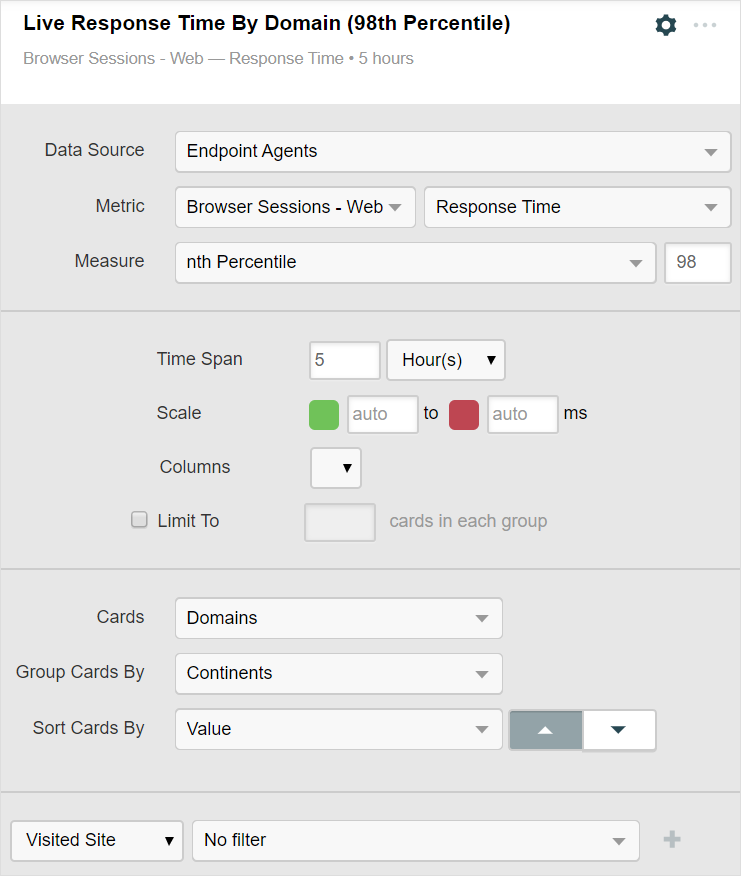
Description: This widget allows you to understand your employees’ response time per website or domain they visit. It will also break out this experience by region so you can focus your attention geographically as necessary.
Setup: Select the “Color Grid” widget and follow the settings below. Feel free to adjust the “Measure” by which you view this data. Here we are showing the experience for the 98th percentile of users. However, you may want to focus on the mean experience or the users with the worst experience. - Experience Score by User for Your Critical Applications
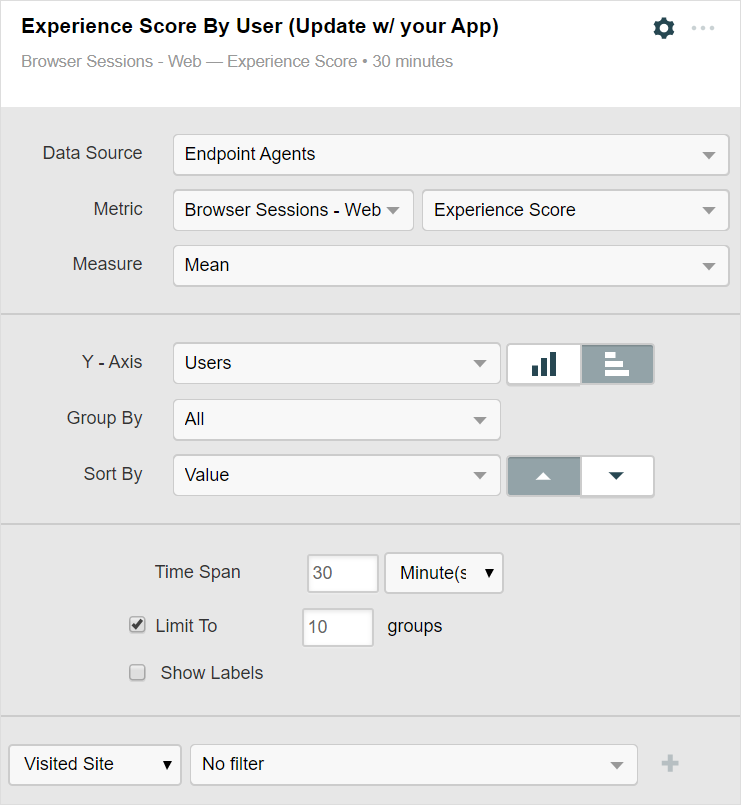
Description: This widget allows you to understand how each user interacts with one of your business-critical applications. It will highlight those users who are experiencing the most problems accessing an application. Feel free to create as many of these as you need!
Setup: Select the “Bar Chart” widget and follow the settings below. Please add a filter on “Visited Site” and filter based on the specific business-critical application that is relevant to your environment (i.e. G-Suite, Office 365, Salesforce, etc.). - CPU Load
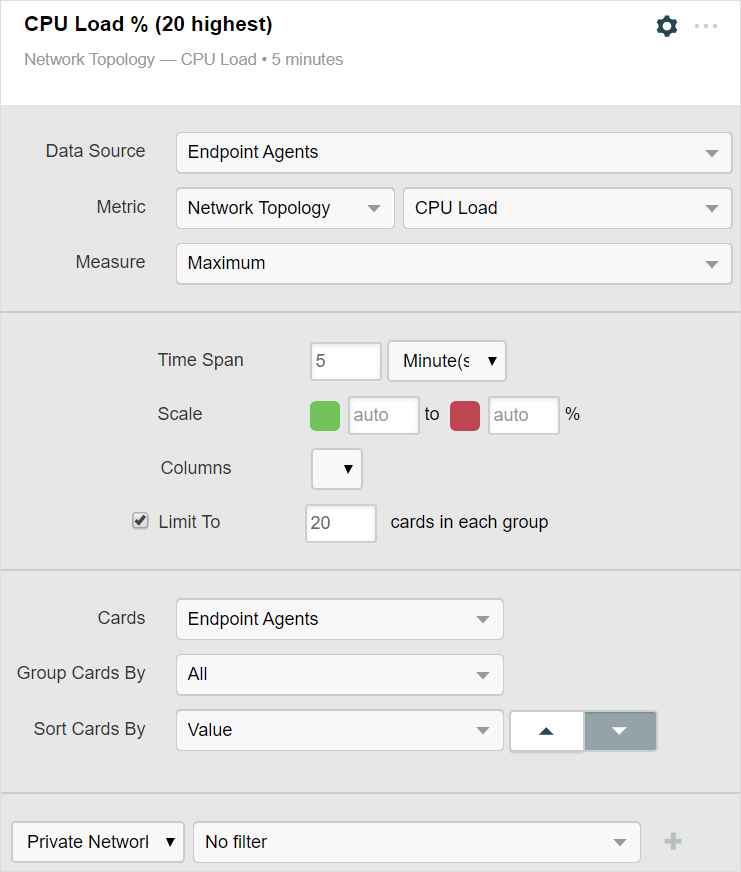
Description: This widget allows you to understand the CPU load that each user is experiencing on their device and will highlight the users who are experiencing the highest CPU load. This is a key data point when trying to troubleshoot or triage a problem on a device.
Setup: Select the “Color Grid” widget and follow these settings. - Memory Load
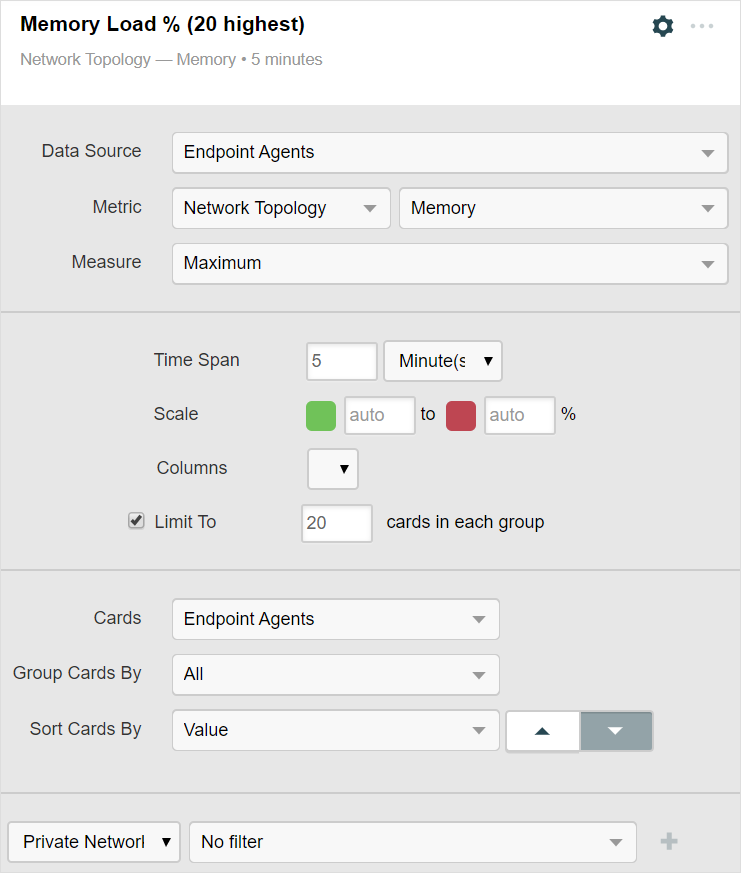
Description: This widget allows you to understand the memory load that each user is experiencing on their device and will highlight the users who are experiencing the highest memory load. This is a key data point when trying to troubleshoot or triage a problem on a device.
Setup: Select the “Color Grid” widget and follow these settings. - Gateway Latency
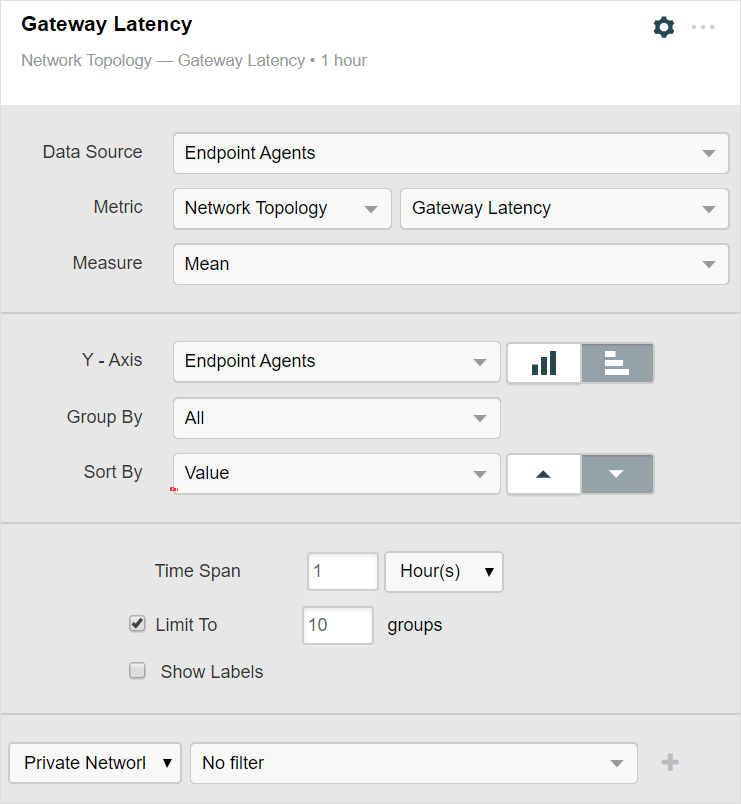
Description: This widget allows you to understand Gateway Latency per user. Gateway latency is the average of the round-trip packet time from the Endpoint Agent to the Gateway.
Setup: Select the “Bar Chart” widget and follow these settings. - Gateway Loss
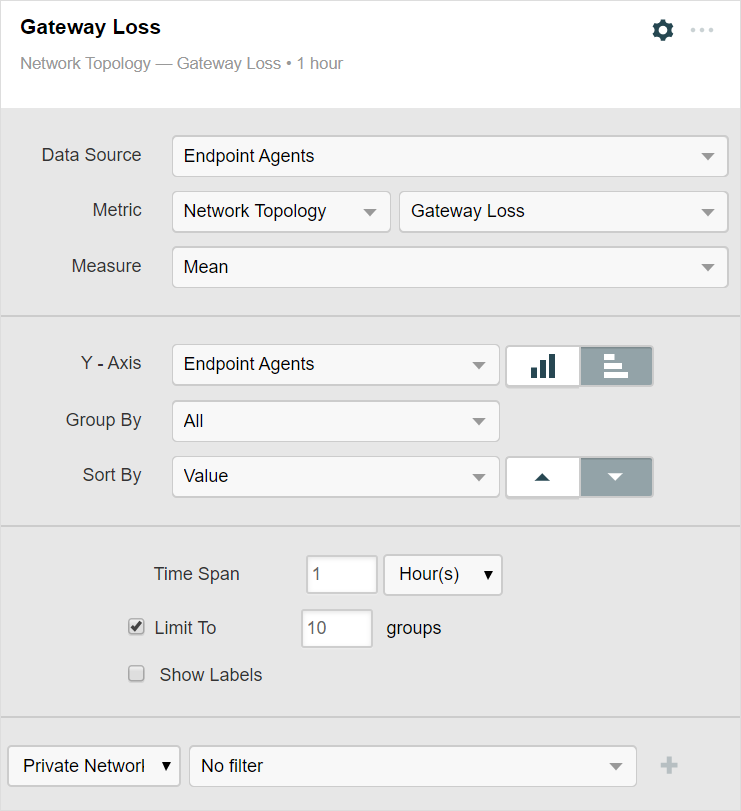
Description: This widget allows you to understand Gateway Loss per user. Gateway Loss is the percentage measurement of lost ICMP Echo Reply packets from the gateway out of the total ICMP Echo Request packets sent.
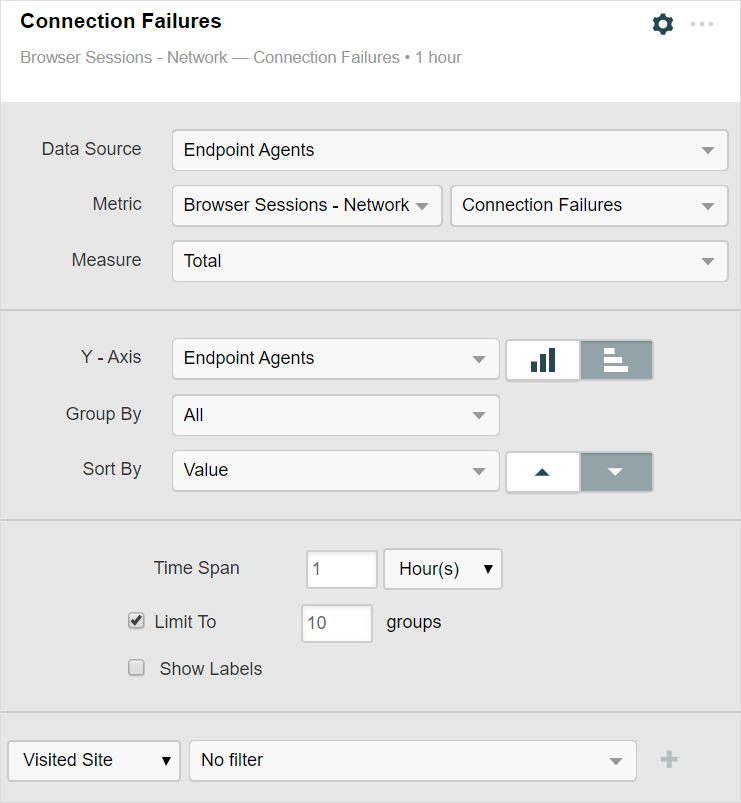
Setup: Select the “Bar Chart” widget and follow these settings. - Connection Failures
Description: This widget allows you to understand how many times an Endpoint Agent has failed a TCP connection in a 10-second timeout window.
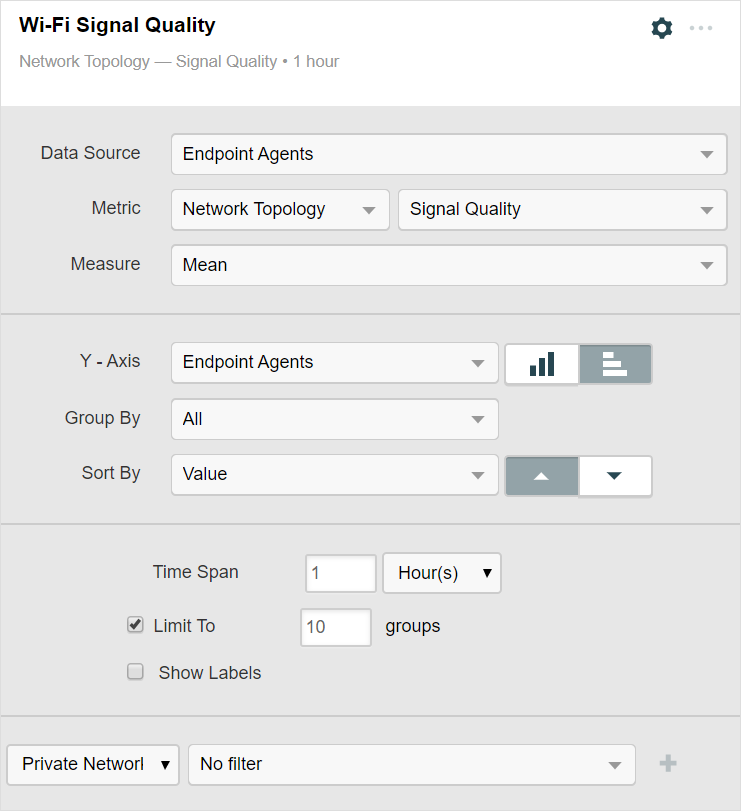
Setup: Select the “Bar Chart” widget and follow these settings. - Wi-Fi Signal Quality
Description:This widget allows you to understand Wi-Fi signal quality per user based on a signal strength measure per device.
Setup: Select the “Bar Chart” widget and follow these settings.
Build this Dashboard
We hope this was helpful. If you want to try to build this dashboard through our API, you can find the appropriate JSON template below.
{
"title": "Home Worker Dash",
"widgets": [
{
"type": "Agent Status",
"title": "Endpoint Agent Status",
"visualMode": "Half screen",
"agents": "Endpoint Agents",
"show": "Owned Agents"
},
{
"type": "Alert List",
"title": "Alert List",
"visualMode": "Half screen",
"alertTypes": [
"Endpoint - End-to-End (Server)",
"Endpoint - Path Trace",
"EndpointWeb - HTTP Server"
],
"limitTo": 10,
"activeWithin": {
"value": 4,
"unit": "Days"
}
},
{
"type": "Color Grid",
"title": "Live Experience Score By Domain (98th Percentile)",
"visualMode": "Half screen",
"dataSource": "Endpoint Agents",
"metricGroup": "Browser Sessions - Web",
"metric": "Web - Endpoint Agent — Experience Score",
"measure": {
"type": "nth Percentile",
"percentileValue": 98.0
},
"fixedTimespan": {
"value": 5,
"unit": "Hours"
},
"cards": "Domains",
"groupCardsBy": "Continents",
"columns": 1,
"sortBy": "Value",
"sortDirection": "Ascending"
},
{
"type": "Color Grid",
"title": "Live Response Time By Domain (98th Percentile)",
"visualMode": "Half screen",
"dataSource": "Endpoint Agents",
"metricGroup": "Browser Sessions - Web",
"metric": "Response Time",
"measure": {
"type": "nth Percentile",
"percentileValue": 98.0
},
"fixedTimespan": {
"value": 5,
"unit": "Hours"
},
"cards": "Domains",
"groupCardsBy": "Continents",
"columns": 1,
"sortBy": "Value",
"sortDirection": "Ascending"
},
{
"type": "Bar Chart: Grouped",
"title": "Experience Score By User (Update w/ your App)",
"visualMode": "Half screen",
"dataSource": "Endpoint Agents",
"metricGroup": "Browser Sessions - Web",
"metric": "Web - Endpoint Agent — Experience Score",
"measure": {
"type": "Mean"
},
"fixedTimespan": {
"value": 30,
"unit": "Minutes"
},
"groupBy": "All",
"axisGroupBy": "Users",
"sortBy": "Value",
"sortDirection": "Ascending",
"limit": 10,
"showLabels": false,
"isHorizontalBarChart": true
},
{
"type": "Color Grid",
"title": "CPU Load % (20 highest)",
"visualMode": "Half screen",
"dataSource": "Endpoint Agents",
"metricGroup": "Network Topology",
"metric": "CPU Utilization",
"measure": {
"type": "Maximum"
},
"fixedTimespan": {
"value": 5,
"unit": "Minutes"
},
"cards": "Endpoint Agents",
"groupCardsBy": "All",
"columns": 1,
"limit": 20,
"sortBy": "Value",
"sortDirection": "Descending"
},
{
"type": "Color Grid",
"title": "Memory Load % (20 highest)",
"visualMode": "Half screen",
"dataSource": "Endpoint Agents",
"metricGroup": "Network Topology",
"metric": "Memory Load",
"measure": {
"type": "Maximum"
},
"fixedTimespan": {
"value": 5,
"unit": "Minutes"
},
"cards": "Endpoint Agents",
"groupCardsBy": "All",
"columns": 1,
"limit": 20,
"sortBy": "Value",
"sortDirection": "Descending"
},
{
"type": "Bar Chart: Grouped",
"title": "Gateway Latency",
"visualMode": "Half screen",
"dataSource": "Endpoint Agents",
"metricGroup": "Network Topology",
"metric": "Gateway Latency",
"measure": {
"type": "Mean"
},
"fixedTimespan": {
"value": 1,
"unit": "Hours"
},
"groupBy": "All",
"axisGroupBy": "Endpoint Agents",
"sortBy": "Value",
"sortDirection": "Descending",
"limit": 10,
"showLabels": false,
"isHorizontalBarChart": true
},
{
"type": "Bar Chart: Grouped",
"title": "Gateway Loss",
"visualMode": "Half screen",
"dataSource": "Endpoint Agents",
"metricGroup": "Network Topology",
"metric": "Gateway Loss",
"measure": {
"type": "Mean"
},
"fixedTimespan": {
"value": 1,
"unit": "Hours"
},
"groupBy": "All",
"axisGroupBy": "Endpoint Agents",
"sortBy": "Value",
"sortDirection": "Descending",
"limit": 10,
"showLabels": false,
"isHorizontalBarChart": true
},
{
"type": "Bar Chart: Grouped",
"title": "Connection Failures",
"visualMode": "Half screen",
"dataSource": "Endpoint Agents",
"metricGroup": "Browser Sessions - Network",
"metric": "Connection Failures",
"measure": {
"type": "Total"
},
"fixedTimespan": {
"value": 1,
"unit": "Hours"
},
"groupBy": "All",
"axisGroupBy": "Endpoint Agents",
"sortBy": "Value",
"sortDirection": "Descending",
"limit": 10,
"showLabels": false,
"isHorizontalBarChart": true
},
{
"type": "Bar Chart: Grouped",
"title": "Wi-Fi Signal Quality",
"visualMode": "Half screen",
"dataSource": "Endpoint Agents",
"metricGroup": "Network Topology",
"metric": "Signal Quality",
"measure": {
"type": "Mean"
},
"fixedTimespan": {
"value": 1,
"unit": "Hours"
},
"groupBy": "All",
"axisGroupBy": "Endpoint Agents",
"sortBy": "Value",
"sortDirection": "Ascending",
"limit": 10,
"showLabels": false,
"isHorizontalBarChart": true
}
]
}