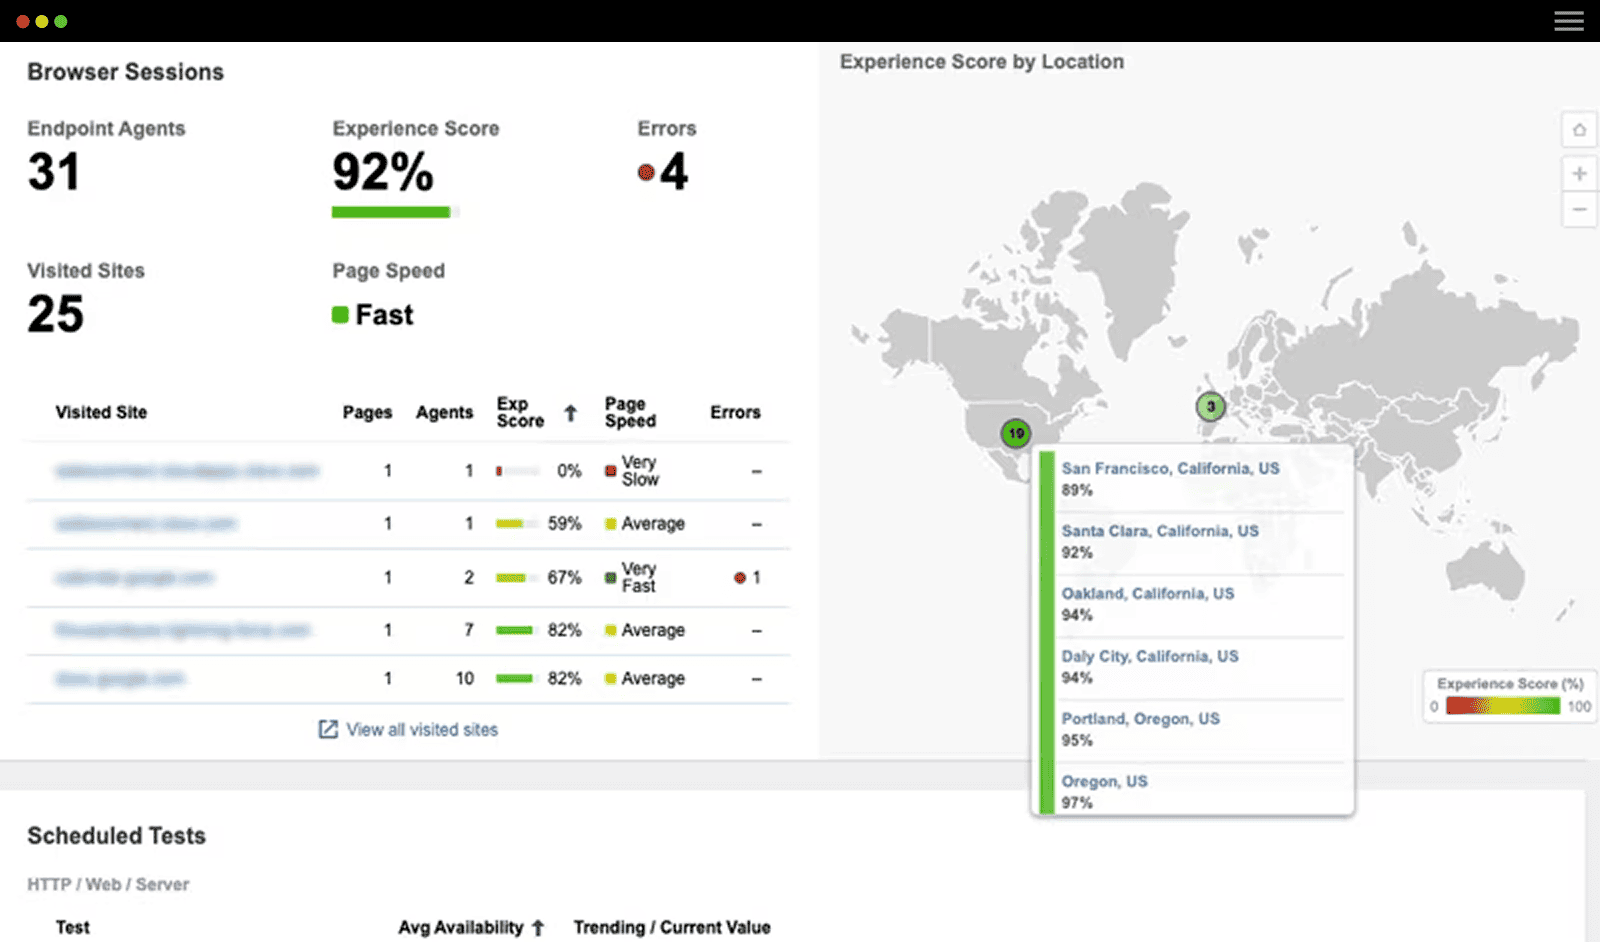
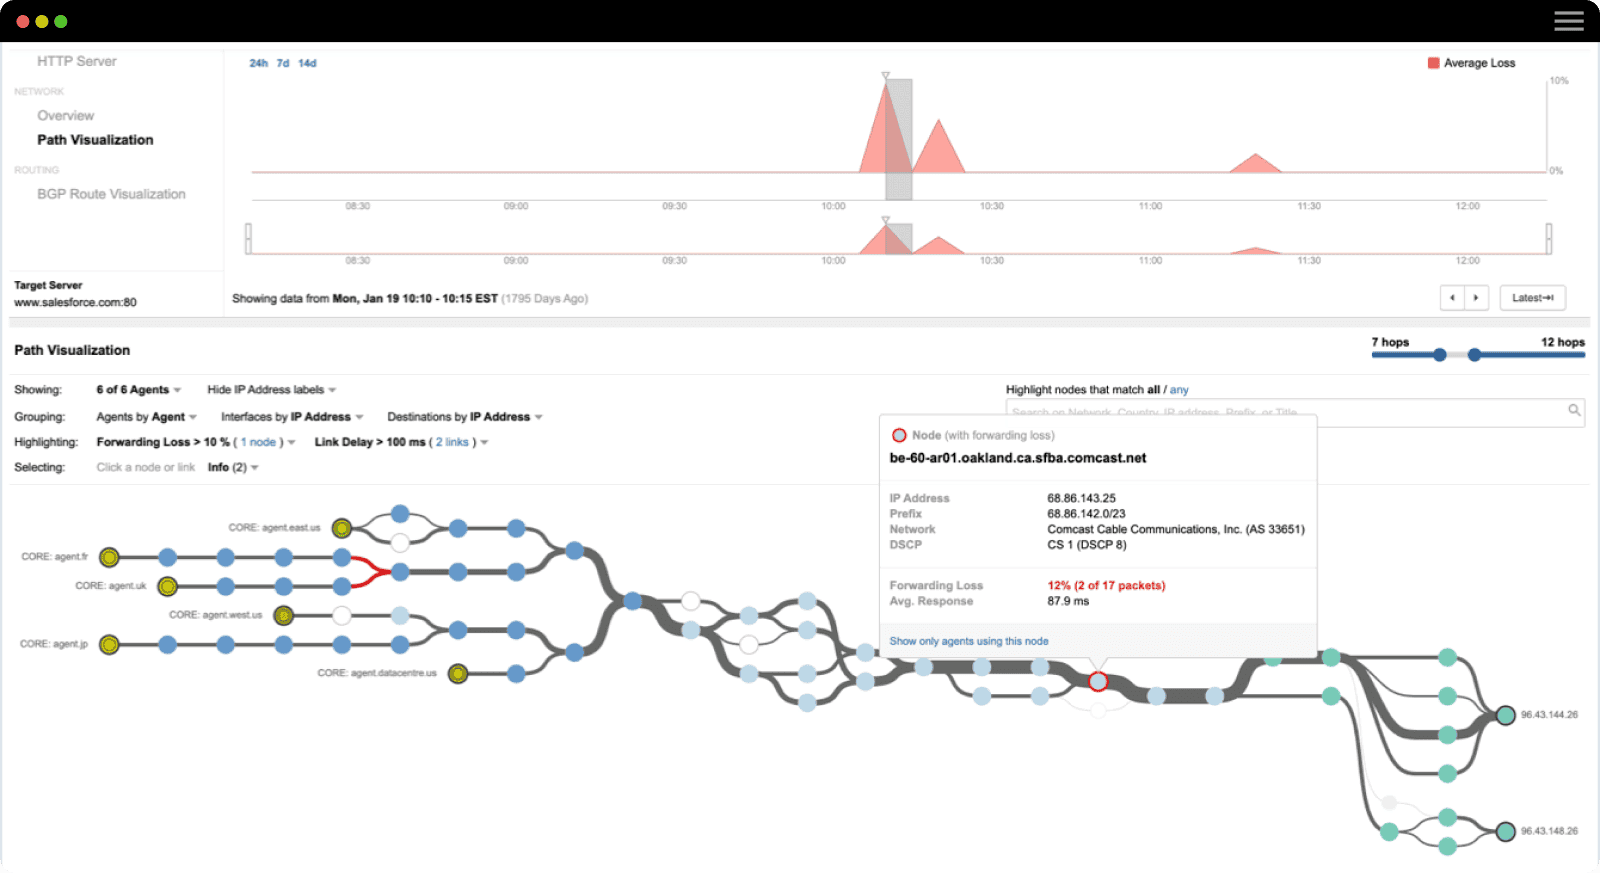
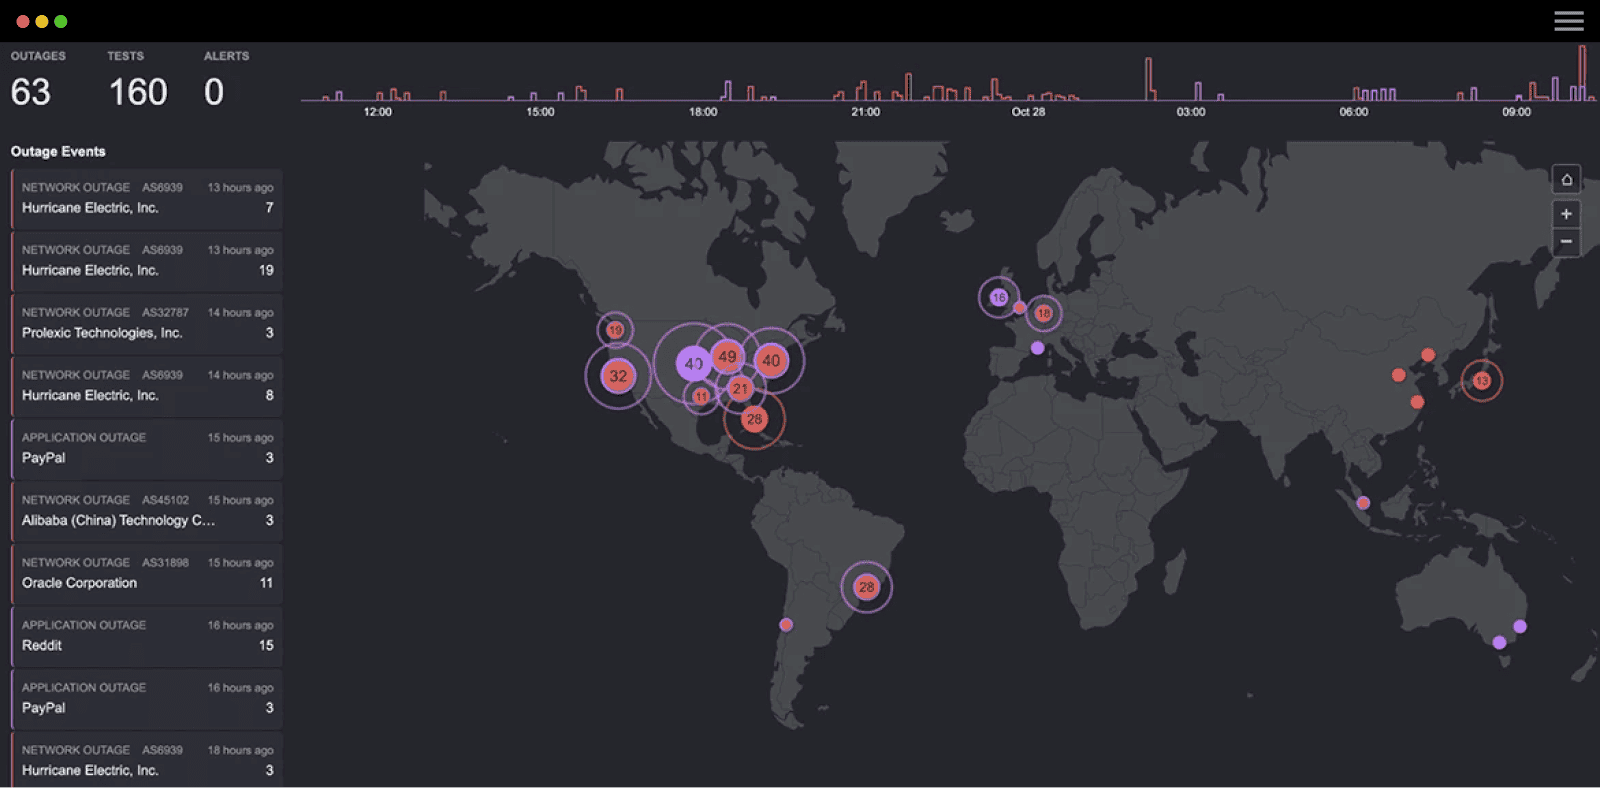
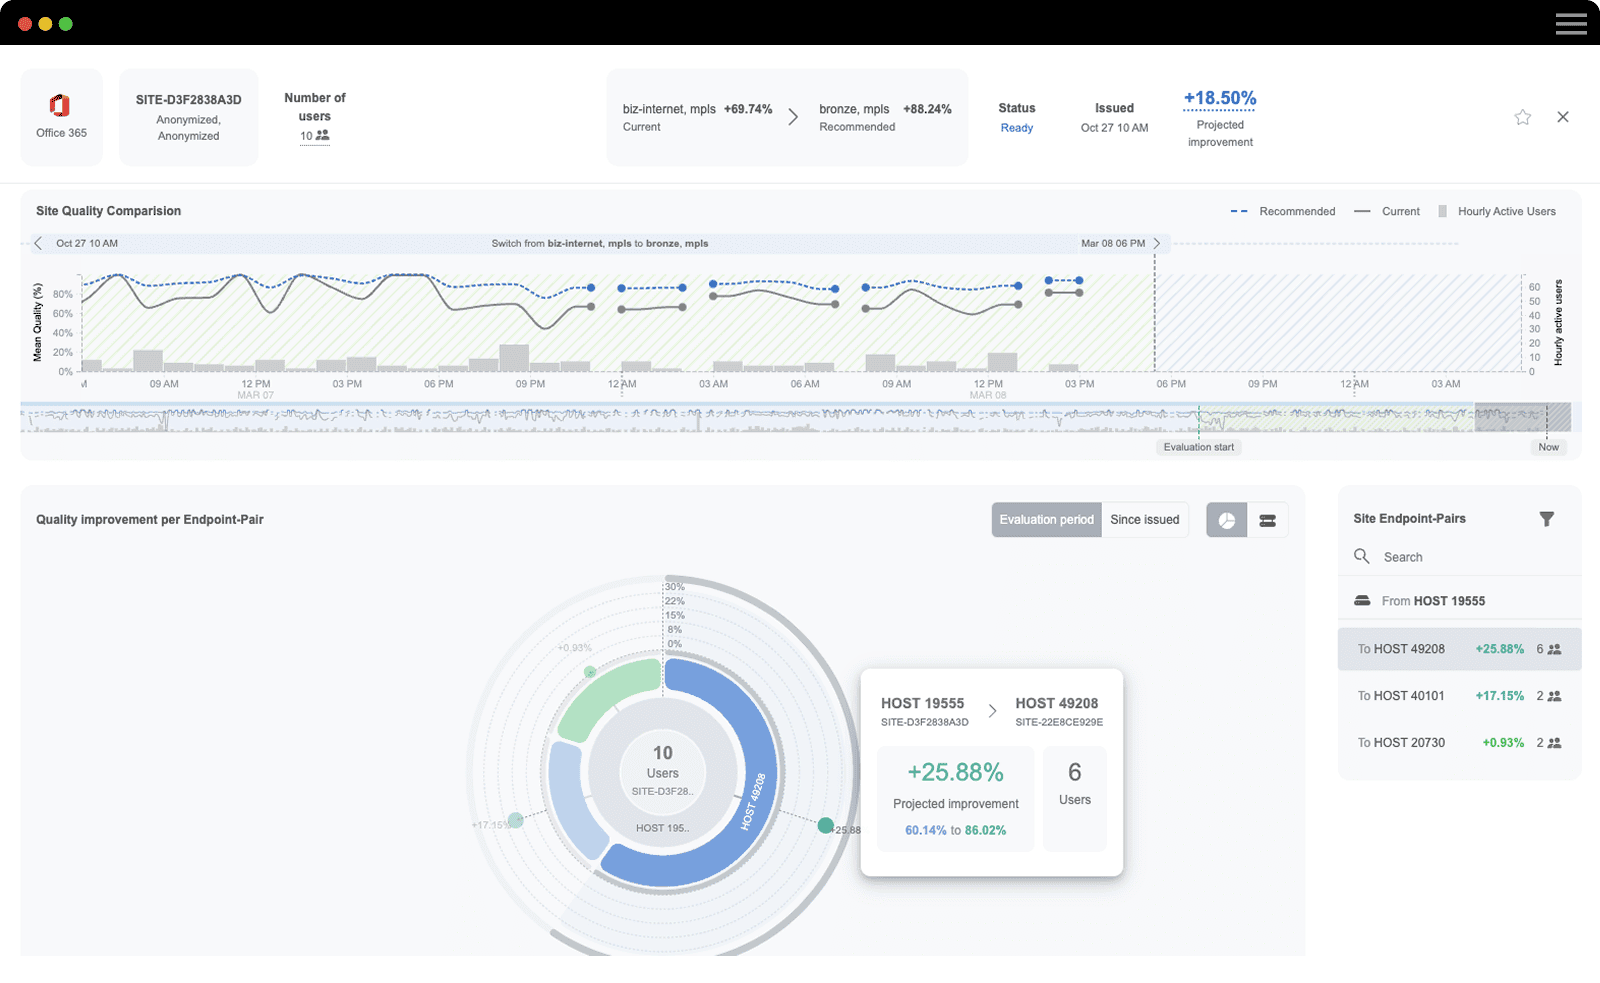
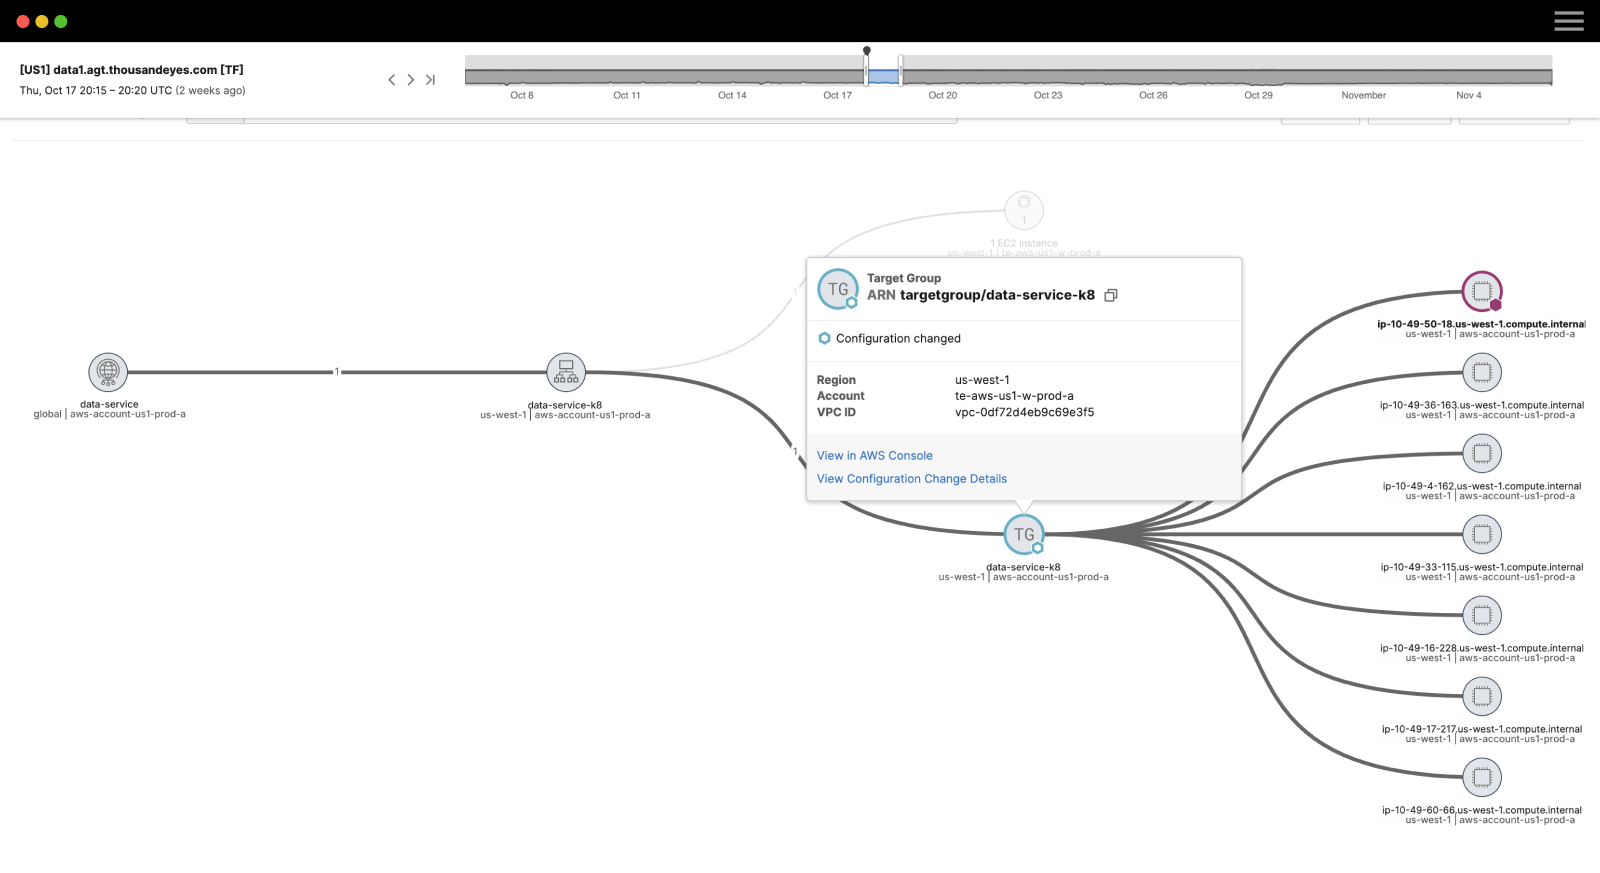
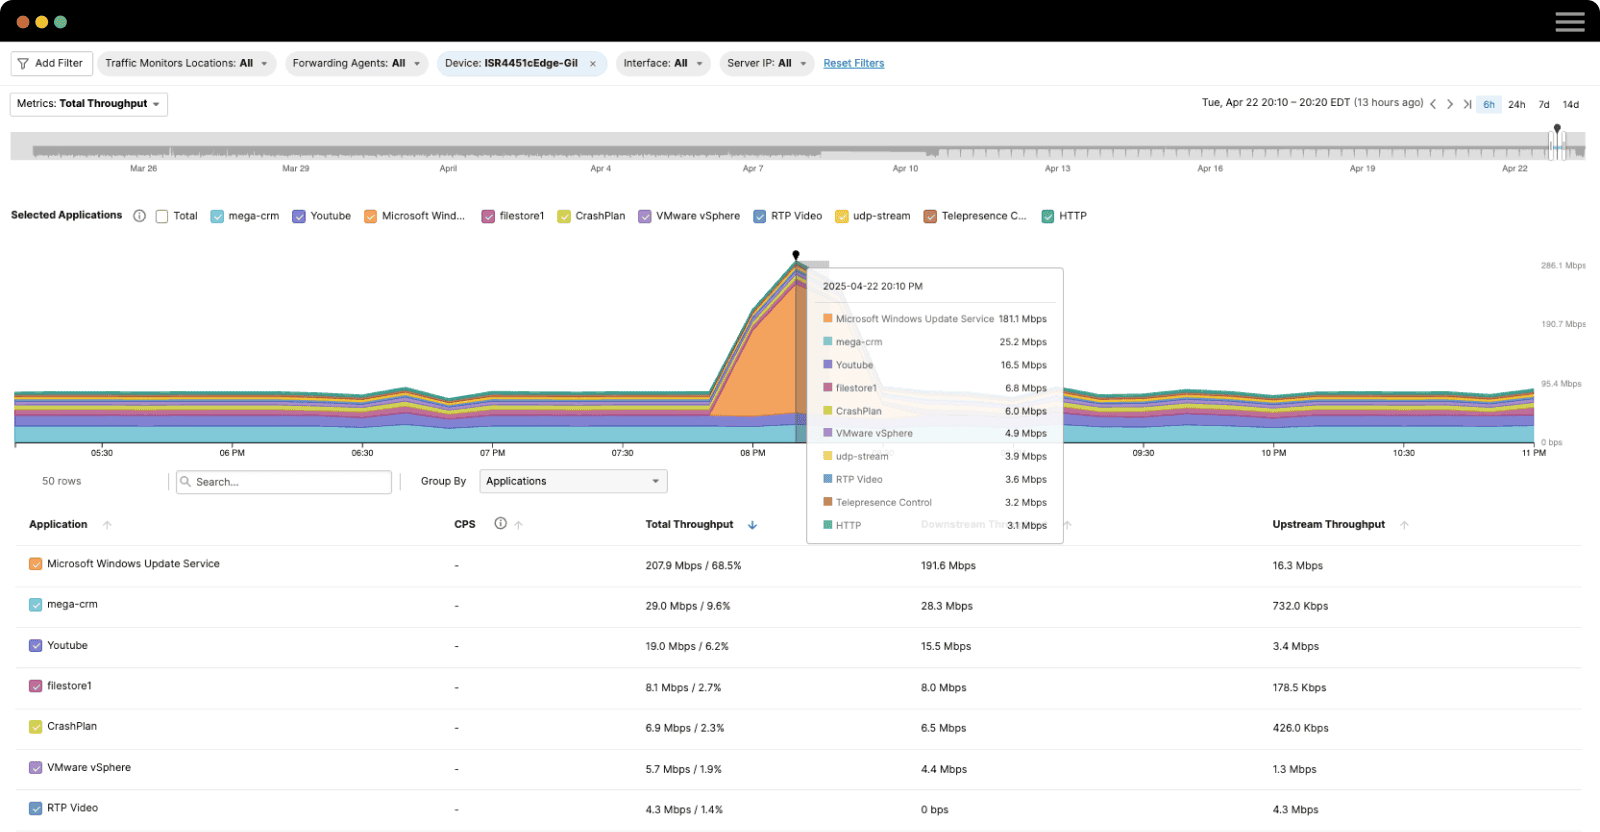
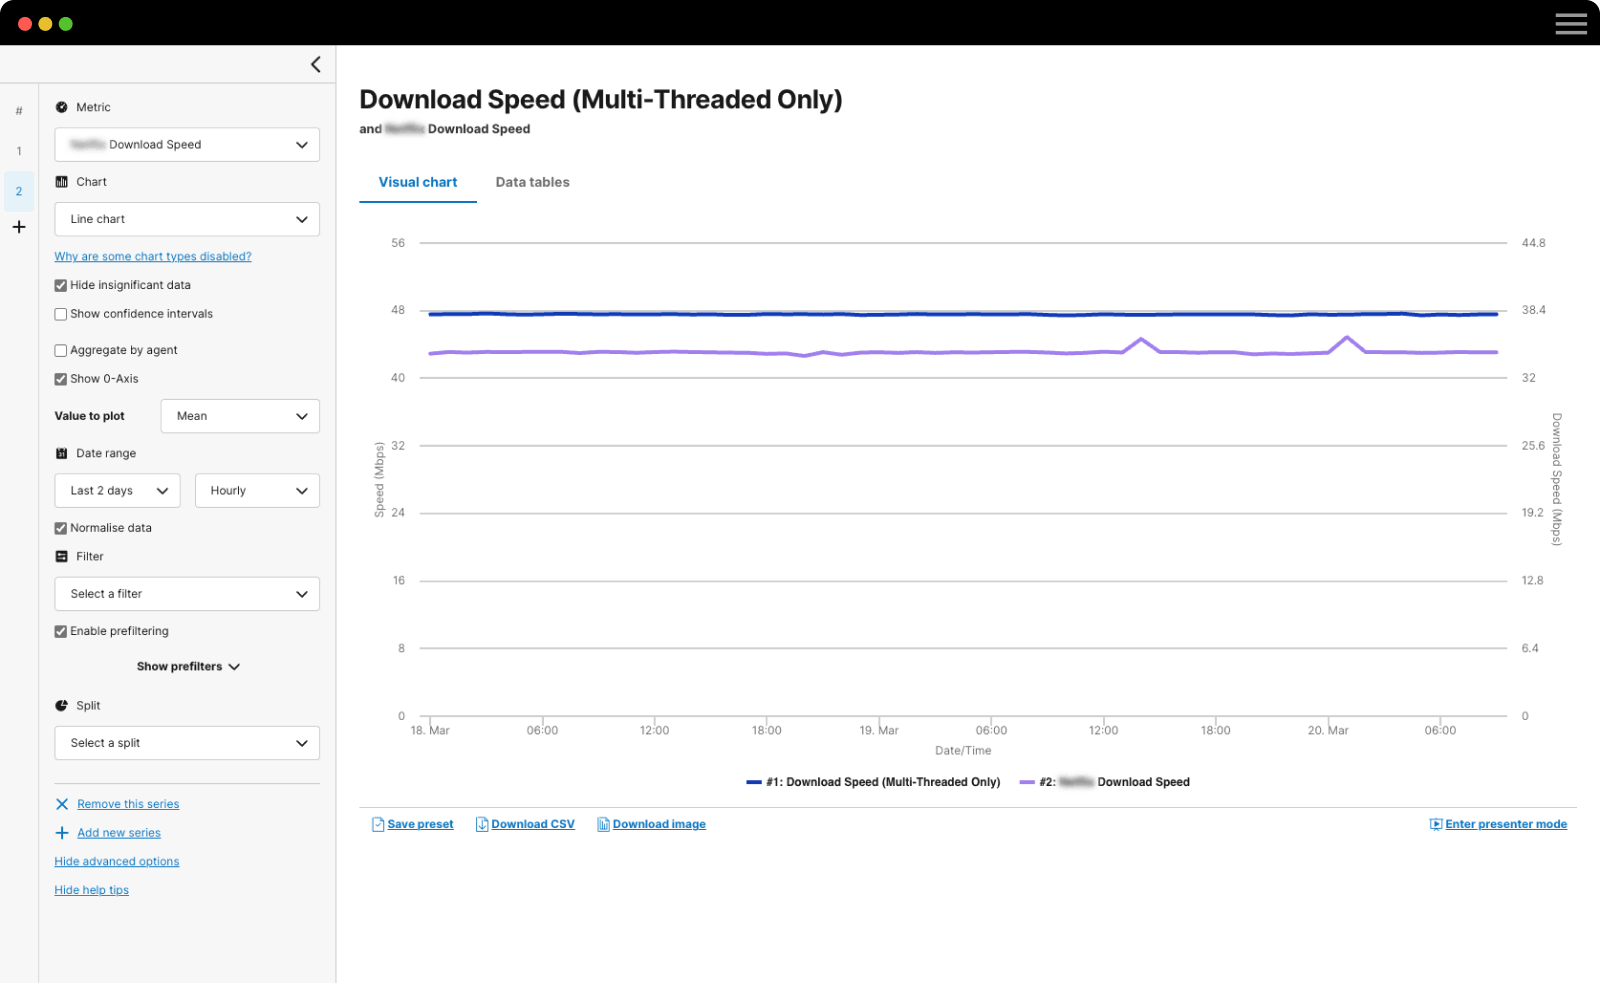
The widespread industry adoption of OpenTelemetry (OTel) presented an opportunity for ThousandEyes to build a system that greatly simplifies integration with OTel-compliant sources. The end result was ThousandEyes for OpenTelemetry, a pipeline for customers to correlate ThousandEyes data within their choice observability platforms. With ThousandEyes for OpenTelemetry, teams can gain powerful insights and visualizations across diverse data sets, facilitating quicker problem-solving and faster service restoration.
In this blog post, we will guide you through three easy steps to sending your ThousandEyes data to any observability backend using OpenTelemetry. But before you get started, you’ll need an active ThousandEyes account. If you’re not a current customer, you can create a 15-day free trial account and follow along.
ThousandEyes data is propagated to other observability backends through the OpenTelemetry Collector using the OTLP exporter, which you can configure to send data using HTTP or GRPC protocol. You’ll be able to select the appropriate configuration when creating the integration.
This tutorial is API-based, so you will need an API token to perform the API request. You can find more information in the ThousandEyes Developer Reference.
Step 1: Create a ThousandEyes Network Test
Before we can send ThousandEyes metrics over OTel, we need to capture some test data. So the first thing we need to do is create a ThousandEyes network test, as shown below:
curl -L 'https://api.thousandeyes.com/v6/tests/agent-to-server/new' -H 'Content-Type: application/json' -H 'Authorization: Bearer $BEARER_TOKEN' -d '{
        "interval": 60,
        "agents": [
          {"agentId": 45}
        ],
        "testName": "OpenTelemetry Test",
        "server": "www.google.com",
        "port": 80,
        "alertsEnabled": 0
      }'
The response will contain a “testId,” which you must provide in the next step. In our case, the testId is 281474976717575.
Step 2: Create a Tag
In this next step, we will create a tag and associate it with our test.
The ThousandEyes Tags API provides a tagging system with key/value pairs. It allows you to tag assets within the ThousandEyes platform (such as agents, tests, or alert rules) with meaningful metadata.
Begin by creating a tag, as shown below.
curl -i -XPOST https://api.thousandeyes.com/v7/tags -H "Content-Type: application/json" -H "Authorization: Bearer $BEARER_TOKEN" -d '{
        "key": "OpenTelemetryTestKey",
        "value": "OpenTelemetryTestValue",
        "objectType": "test",
        "accessType": "all"
      }'
The response will contain a “tagId,” which you must provide in the next step. For example, 17f6cccd-cc43-450d-925d-04b400847e82.
Then, associate the test with a tag by entering the following command.
curl -i -XPOST https://api.thousandeyes.com/v7/tags/17f6cccd-cc43-450d-925d-04b400847e82/assign -H "Content-Type: application/json" -H "Authorization: Bearer $BEARER_TOKEN" -d '{
  "assignments": [
    {
      "id": "281474976717575",
      "type": "test"
    }
  ]
}'
Step 3: Create an Integration
Now that we have some data available, we can create the streaming integration by providing a target endpoint, the tag key and value (from the previous step), and the protocol that we want to use (HTTP or GRPC). The target endpoint will depend on the observability backend you use. Let’s walk through a few integrations with different observability vendors.
Splunk Observability
Splunk only allows receiving data using HTTP protocol. Create an HTTP stream integration by entering the following command.
curl -v -XPOST https://api.thousandeyes.com/v7/stream -H "Content-Type: application/json" -H "Authorization: Bearer $BEARER_TOKEN" -d '{
  "type": "opentelemetry",
  "tagMatch": [{
    "key": "OpenTelemetryTestKey",
    "value": "OpenTelemetryTestValue",
    "objectType": "test"
  }],
  "endpointType": "http",
  "streamEndpointUrl": "https://ingest.eu0.signalfx.com:443/v2/datapoint/otlp",
  "customHeaders" : {
    "X-SF-Token": "TOKEN",
    "Content-Type": "application/x-protobuf"
  }
}'
In Splunk, you can confirm that the data has been received, as shown in Figure 1.

The endpoint to send the data to Splunk is “https://ingest.{REALM}.signalfx.com/v2/datapoint/otlp”. “Realm” is the region of your observability instance. You can find more information about Realm at https://docs.splunk.com/Splexicon:Realm.
For more information on sending metrics to Splunk using OpenTelemetry, visit the Splunk Developer Guide.
Honeycomb
Honeycomb allows the receiving of data using HTTP and GRPC protocols. To create the GRPC integration, enter the following command.
 curl -v -XPOST https://api.thousandeyes.com/v7/stream -H "Content-Type: application/json" -H "Authorization: Bearer $BEARER_TOKEN" -d '{
  "type": "opentelemetry",
  "tagMatch": [{
    "key": "OpenTelemetryTestKey",
    "value": "OpenTelemetryTestValue",
    "objectType": "test"
  }],
  "endpointType": "grpc",
  "streamEndpointUrl": "https://api.honeycomb.io:443",
  "customHeaders" : {
    "x-honeycomb-team": "TOKEN",
    "x-honeycomb-dataset": "OpenTelemetryTestGrpc"
  }
}'
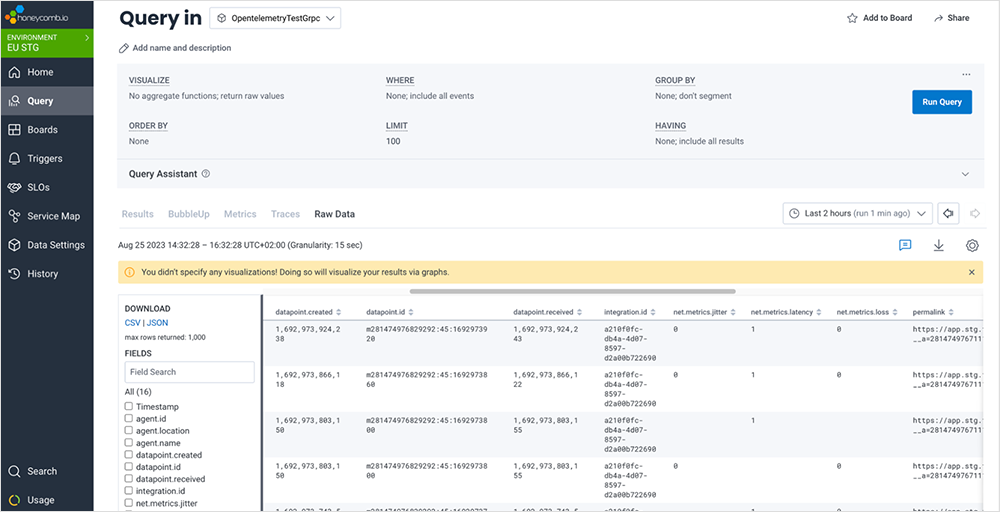
In Honeycomb, you can confirm that the platform received the data, as shown in Figure 2 and Figure 3.
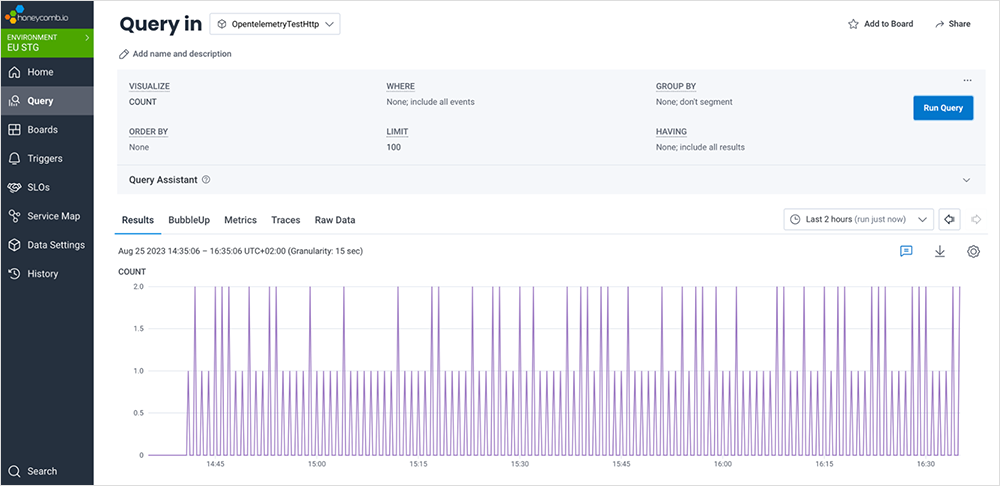
You can find information about how to access the Honeycomb token at the following link: https://docs.honeycomb.io/working-with-your-data/settings/api-keys/.
For more information on sending metrics to Honeycomb using OpenTelemetry, visit https://docs.honeycomb.io/getting-data-in/otel-collector/.
Signoz
Signoz allows the receiving of data using HTTP and GRPC protocols. To create the GRPC integration, enter the following command.
 curl -v -XPOST https://api.thousandeyes.com/v7/stream -H "Content-Type: application/json" -H "Authorization: Bearer $BEARER_TOKEN" -d '{
  "type": "opentelemetry",
  "tagMatch": [{
    "key": "OpenTelemetryTestKey",
    "value": "OpenTelemetryTestValue",
    "objectType": "test"
  }],
  "endpointType": "grpc",
  "streamEndpointUrl": "https://ingest.eu.signoz.cloud:433",
  "customHeaders" : {
    "signoz-access-token": "SIGNOZ_INGESTION_KEY"
  }
}'
The endpoint to send the data to Signoz is “https://ingest.<region>.signoz.cloud:443”. The regions could be “eu”, “us” and “in”. For the SIGNOZ_INGESTION_KEY, the API token is provided by Signoz. You can find your ingestion key in the SigNoz cloud account details sent to your email. You can also find more information at https://signoz.io/docs/userguide/logs.
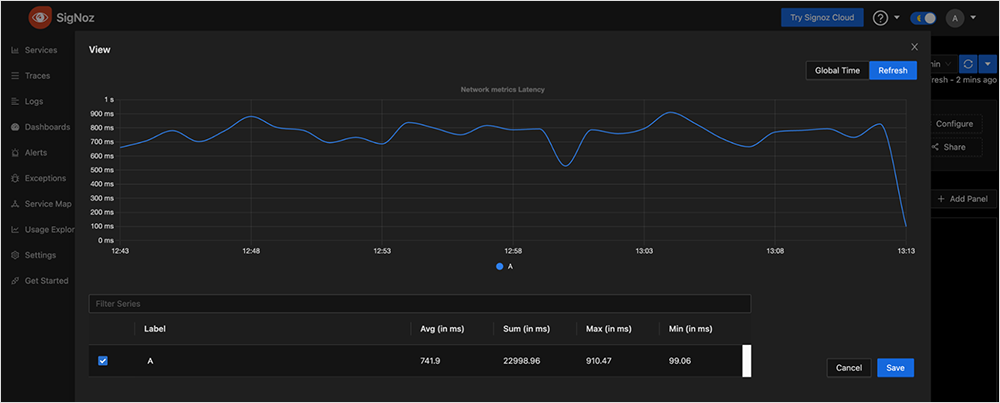
In Signoz, you can confirm that the platform has received the data, as shown in Figure 4.
Grafana
Grafana allows the receiving of data using HTTP protocol. To create an HTTP stream integration, enter the following command.
 curl -v -XPOST https://api.thousandeyes.com/v7/stream -H "Content-Type: application/json" -H "Authorization: Bearer $BEARER_TOKEN" -d '{
  "type": "opentelemetry",
  "tagMatch": [{
    "key": "OpenTelemetryTestKey",
    "value": "OpenTelemetryTestValue",
    "objectType": "test"
  }],
  "endpointType": "http",
  "streamEndpointUrl": "https://otlp-gateway-prod-us-central-0.grafana.net/otlp/v1/metrics",
  "customHeaders" : {
    "Authorization": "Basic $(echo -n $GRAFANA_INSTANCE_ID:$GRAFANA_CLOUD_ACCESS_POLICY_TOKEN | base64)"
  }
}'
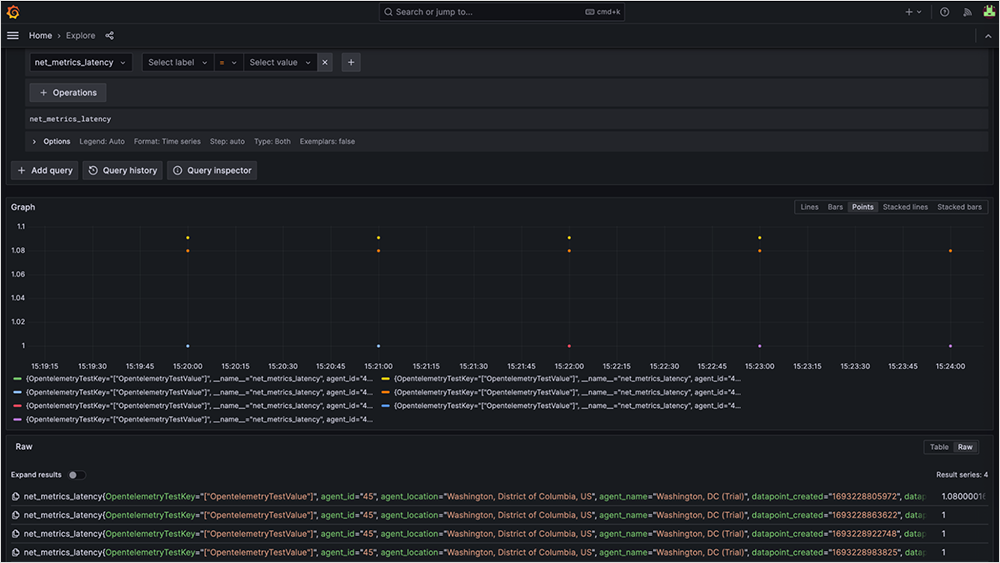
In Grafana, you can confirm that the platform has received the data, as shown in Figure 5.

For more information on sending metrics to Grafana using OpenTelemetry, visit: https://grafana.com/docs/grafana-cloud/monitor-infrastructure/otlp/send-data-otlp/.
With its support for the OpenTelemetry format, ThousandEyes has opened the doors for more meaningful insights across the observability space. So whether you’re using Cisco AppDynamics, Grafana, Splunk, or one of many options on the market today, your favorite OTel-compliant platform can now consume ThousandEyes metrics.
