This is The Internet Report, where we analyze outages and trends across the Internet through the lens of ThousandEyes Internet and Cloud Intelligence. I’ll be here every other week, sharing the latest outage numbers and highlighting a few interesting outages. As always, you can read the full analysis below or listen to the podcast for firsthand commentary.
Internet Outages & Trends
Outages stemming from backend issues were somewhat of a theme in the first half of the year and this trend appears to be continuing.
In recent weeks, we’ve seen several service disruptions that appeared backend related, impacting organizations including a social media platform, an Australian bank, and a major airline. These incidents provide important insights into the typical symptoms of backend outages and strategies for spotting them.
Read on to learn more about these events and the distinct anatomy of a backend outage, with possible characteristics including being able to reach the “front door” of service but then finding the application is unusable, simultaneous failure across multiple platforms or regions, server-side HTTP 5xx errors, and an evolving pattern of errors as the outage progresses.
Read on to learn more about what we observed during these incidents (or use the links below to jump to the sections that most interest you):
X Service Disruption
On October 1, ThousandEyes observed a service disruption affecting X across multiple regions. While the social media platform remained reachable and login functionality appeared intact, content delivery and posting services exhibited failures.
The service disruption appeared to start around 4:46 AM (UTC), with the main portion lasting around one hour and 45 minutes and residual instability observed as the service recovered.
From ThousandEyes observations, the disruption had three distinct phases:
1. Service Degradation: First, the application became intermittently available at best, with initial page resources successfully loading from content delivery network (CDN) providers, but critical JavaScript resources required for the application to function (manifest.json, vendor bundles from x.com and abs.twimg.com domains) either timing out or returning a "No Response" error message. As a result, it appeared that users were able to access the X platform, but were greeted by nothing but a black screen with the X logo displayed.

Figure 1. During the first phase of the X service disruption, it appeared that users could access the platform, but only saw a black screen with the X logo
2. Complete Request Failure: As the disruption progressed, page requests began timing out entirely with no response. Instead of the black error screen with the X logo, it looked like users were now just seeing a blank white screen.
3. Controlled Error Response: Then, as the service started to recover, the application appeared to start serving a client-side error handler message that read "Something went wrong, but don't fret—it's not your fault"). This indicated that the base application shell was now loading successfully and the necessary JavaScript execution was occurring. The application seemed to be detecting its own internal failure state and displaying fallback UI prepared for disruptions like this.

Figure 2. During the third phase of the X service disruption, users appeared to receive a client-side error handler message that read "Something went wrong, but don't fret—it's not your fault."
This failure pattern suggested an issue beyond a simple network or web server failure. During the disruption, users could still reach CDN endpoints and receive responses (evidenced by the rendered logo and page shell), indicating that network reachability to X's infrastructure was functional. CDNs act as the "front door" to a service—they're geographically distributed edge servers that sit between users and the application's origin servers. When a user requests x.com, they first reach a CDN node.
While users could reach this front door, they seemed to encounter issues when requests needed to reach back to origin/backend services. These problems point to backend issues as the likely root cause: perhaps a backend API or service timing out during the page initialization, asset delivery issues from specific CDN endpoints, or an application configuration service that was unavailable.
The recovery pattern was also consistent with possible backend issues, with the recovery happening in stages, in reverse order of failure. This could suggest a gradual restoration of backend services.
Anthropic's Claude Outage
On October 3, at approximately 1:17 AM (UTC), ThousandEyes observed issues affecting Anthropic’s AI assistant Claude globally. Anthropic's status page confirmed the incident, reporting that Claude.ai, Claude Code, and the Claude API and Console were all experiencing degraded service.
During the outage, the system appeared to be online—ThousandEyes monitoring showed the service was reachable—yet every request was being rejected with HTTP 429 "Too Many Requests" errors. When a service starts returning 429 errors globally and simultaneously, it's tempting to assume the system is simply overloaded. However, in this case, the HTTP 429 response code didn’t seem to be telling the whole story. It appeared to be merely a symptom pointing to a much more specific backend infrastructure failure.
Explore Anthropic’s Claude outage further in the ThousandEyes platform (no login required).

Figure 3. During the outage, users received HTTP 429 "Too Many Requests" errors
To understand the 429 errors and what likely happened, it’s helpful to understand how rate limiting works in modern distributed systems. When you're running a service at global scale with servers in multiple regions, you can't have each server independently deciding whether a user has exceeded their rate limit. If you did that, a user could make 100 requests to Server A, another 100 to Server B, and another 100 to Server C—effectively bypassing a "100 requests per minute" limit.
Modern distributed rate limiting architectures solve this by using a centralized rate limiter that maintains a single, shared count of requests across all application servers, allowing the system to enforce precise limits across all application servers. Typically, this is implemented using a fast, in-memory database, such as Redis. These systems can handle millions of operations per second and track the number of requests each user has made.
When this centralized rate limiting service fails or becomes unavailable, the application servers face a decision. They can either:
- Fail open (allow all traffic through without rate limiting)
- Fail closed (reject all traffic to protect the backend)
In many distributed systems, the design choice is to fail-safe by rejecting all requests with HTTP 429 errors when the rate limiting service fails. This prevents a flood of uncontrolled traffic from overwhelming backend databases and services when the protection layer is down. It's the equivalent of a security door that automatically locks when the alarm system loses power—not ideal for user experience, but it protects critical infrastructure.
In the case of Anthropic’s Claude outage, the 429 errors were likely a symptom of a problem with Anthropic’s centralized rate limiting service, perhaps triggered by a configuration change or a synchronization bug that may have caused all regional rate limiters to incorrectly believe that limits were exceeded globally.

Figure 4. Visitors to claude.ai/new received a “rate exceeded” error message

Figure 5. The desktop app also received “Couldn’t connect to Claude” error messages
Anthropic’s post-incident report also pointed to a backend infrastructure issue, leaving open the possibility that a rate limiter problem was the root cause. The report said the outage was caused by an upstream provider error that revealed an unexpected problem in Anthropic’s infrastructure.
Until Anthropic issues a more detailed report, we can’t definitively say whether rate limiter issues were the cause, but it does indeed appear this was a backend infrastructure issue where the HTTP 429 responses were the symptom, not the disease—a distinction that's crucial for understanding modern distributed system failures.
Commonwealth Bank Outage
On October 2, Commonwealth Bank (CommBank) customers across Australia experienced issues accessing their funds. The outage affected the bank's mobile app, online banking platform, and physical ATM network simultaneously, reportedly lasting about two hours before services began being restored around 2:30 PM (AEST). ATMs displayed messages indicating they had entered standby mode and were unable to dispense cash or accept deposits.
The fact that the bank's mobile app, website, and physical ATM network all failed at the same moment pointed to a specific type of backend infrastructure problem.
Modern banks typically do not operate separate systems for ATMs, mobile apps, and online banking. Instead, these are usually different "channels" that all connect to shared backend infrastructure. This infrastructure includes authentication systems, authorization services, and the core banking platform that maintains the definitive record of every customer's accounts and balances. Given that CommBank’s mobile app, website, and physical ATM network all experienced issues simultaneously, it’s our best guess that the root cause lies somewhere in this shared backend infrastructure.
But where exactly in the backend infrastructure did the problem occur? The ATMs reportedly going into standby mode—rather than simply displaying error messages—left another clue. Standby mode is typically a programmed state that ATMs enter when they detect they cannot reach the services necessary to safely authorize transactions. It's a fail-safe mechanism.
This protective behavior suggested that the failure was likely deep in the authorization chain, probably at the core banking system or authentication service level, rather than at the ATM network edge. While we cannot confirm the exact technical reason without internal visibility into CommBank’s systems, the behavior pattern is consistent with loss of connectivity to critical authorization services.
This outage demonstrates the challenge of shared dependencies in distributed systems. The architectural decision to have all banking channels connected to centralized backend services creates efficiency and consistency—there's one authoritative source of truth for your account balance. But it also creates a single point of failure. It’s important for organizations to identify any single points of failure in their own service delivery chains and if they can’t be avoided, have backup plans and mitigation strategies in place should the need arise.
In CommBank’s case, services were restored by 2:30 PM (AEST), likely through failover to redundant systems, a service restart, or resolution of whatever underlying failure triggered the cascade.
Alaska Airlines Outage
On September 25, at approximately 3:10 AM (UTC), ThousandEyes observed widespread accessibility issues affecting Alaska Airlines' website (alaskaair.com). Our tests showed intermittent failures—some requests successfully loaded the site, while others encountered error pages or timeouts. This inconsistent behavior, where the service appeared to work one moment and then fail the next, indicated this was a partial backend degradation rather than a complete outage.
In a typical web infrastructure, there are multiple backend servers handling requests. The load balancer distributes traffic among them. If some servers are healthy and others are not, you get exactly the pattern observed during the Alaska Airlines outage:
- Request A gets routed to a healthy server → succeeds
- Request B gets routed to a failed/overloaded server → 503 error (indicating a server-side problem—issues with the website's infrastructure, not with the connection or request)
- Request C gets routed to a degraded server that's too slow → timeout (meaning the backend server didn't respond within the expected timeframe)
The combination of 503 errors and page load timeouts appeared to represent different manifestations of the same underlying problem. A 503 occurs when a backend server can't respond at all—it's completely unavailable or immediately rejects the connection. A timeout happens when the backend server is reachable but processing requests so slowly that the load balancer or browser gives up waiting.

Figure 6. ThousandEyes observed 503 errors during the outage
Explore the Alaska Airlines outage further in the ThousandEyes platform (no login required).
Further supporting our hypothesis that backend issues were the root cause, network problems didn’t seem to be at play. Network issues tend to be geographic—a fiber cut affects a region, a BGP routing problem affects certain paths, a DDoS attack might target specific entry points. However, the Alaska Airlines outage appeared to simultaneously impact multiple places across the globe. ThousandEyes data showed failures in North America, Europe, Asia, and other regions, pointing to an application infrastructure issue.

Figure 7. The outage impacted multiple continents simultaneously, suggesting that it was an application infrastructure issue, not a network problem
Additionally, the network path analysis showed minimal packet loss during the outage period. The brief spike in the loss graph corresponded to the outage window, but crucially, the error type was "receive errors"—not connection failures, not routing problems, not packet loss in transit. "Receive errors" meant that the network successfully delivered the request to Alaska's infrastructure, but the response from that infrastructure was an error. Think of it like successfully making a phone call to a business, hearing it ring, having someone pick up, but then being told "sorry, we can't help you right now." The communication channel works fine; the problem is on their end.

Figure 8. ThousandEyes observed minimal packet loss during the outage
This Alaska Airlines outage underscores how determining what didn’t cause an outage is an important step on your journey to figuring out what did. When investigating an outage, gather all available data and systematically eliminate possible root causes—starting with the network.
Gong Service Disruption
On September 25, Gong, a revenue intelligence platform, experienced a service disruption that affected users' ability to access the application. The types of errors observed changed throughout the incident, appearing to be an example of how backend-related disruptions can happen in stages, with the service displaying further degradation as the incident progresses.

Figure 9. During the service disruption, ThousandEyes observed both 502 and 504 errors, as well as 503 errors
Explore the Gong service disruption further in the ThousandEyes platform (no login required).
Phase 1: Initial Timeouts: The initial symptoms appeared as receive timeouts—requests that successfully reached Gong's infrastructure but received no response within expected timeframes. This suggested that whatever infrastructure component initially handled requests became unable to process them efficiently. This pattern often emerges when systems become overloaded—they accept connections but can't process them quickly enough, causing requests to time out while waiting for responses.
Phase 2: Mixed Error State: As the incident progressed, the error pattern evolved into a mix of HTTP 502 Bad Gateway, 503 Service Unavailable, and 504 Gateway Timeout errors, alongside continued receive timeouts. This heterogeneous error pattern is characteristic of distributed systems where different components or different instances of the same component are failing in different ways:
- Some may be completely unresponsive (timeouts or 504s)
- Others may be crashing or returning malformed responses (502s)
- Some may recognize overall system degradation and return 503s
Phase 3: Growing 502 Prevalence: As the disruption moved deeper into what appeared to be its most severe phase, 502 Bad Gateway errors seemed to become more prevalent in the error mix. The increase in 502 errors suggested that more components were likely either crashing under load or experiencing internal failures that prevented them from generating valid HTTP responses. A 502 error specifically indicates receipt of an invalid response, which commonly occurs when a process crashes mid-request or when a critical dependency fails catastrophically.

Figure 10. As the service disruption progressed further, 502 errors became more prevalent
This pattern could have been caused by a number of possible backend issues including backend services becoming overloaded; a critical shared service—such as a database, cache layer, or authentication service—becoming overloaded or unavailable; or a resource exhaustion scenario where backend servers gradually ran out of memory, file handles, database connections, or other critical resources. However, it's also possible that the failures originated at the CDN or load balancer layer rather than the application backend. If Gong's CDN couldn’t reach their origin servers (due to network issues, firewall problems, or origin server unavailability), it would generate 502/503/504 errors that would look identical to application-generated errors from an external monitoring perspective.
While we can’t definitively say exactly what caused the disruption, it’s likely that this incident is an example of how backend failures often don't happen all at once. Instead, distributed systems can experience progressive degradation where the health of the system deteriorates over time, manifesting as an evolving pattern of error types. The initial timeouts suggested components struggling to keep up, while the eventual prevalence of 502 errors indicated components actively failing or crashing.
Understanding these error progression patterns helps distinguish between different types of infrastructure failures, even when we lack internal visibility. A sudden switch to all 503 errors might suggest intentional service shutdown or a deliberate rate limiting decision. Uniform 504 timeouts might indicate a network partition or connectivity issue. But this mixed, evolving pattern of timeouts transitioning to various 5xx errors painted a picture of systems struggling and progressively failing under load or due to an internal fault—though without access to Gong's internal systems, this remains an informed inference rather than a definitive diagnosis.
By the Numbers
Let’s close by taking a look at some of the global trends ThousandEyes observed over recent weeks (September 22 - October 5) across ISPs, cloud service provider networks, collaboration app networks, and edge networks.
Global Outages
- From September 22-28, ThousandEyes observed 305 global outages, representing a slight 1% increase from 302 the prior week (September 15-21). This continued the elevated plateau of around 300 outages per week that had persisted throughout September.
- However, during the week of September 29 - October 5, global outages experienced a dramatic 26% decline, dropping to 226. This sharp drop marked the end of the sustained period of elevated disruption levels that characterized most of September.
United States Outages
- The United States saw outages climb to 171 during September 22-28, representing a 6% increase from the previous week's 161.
- During September 29 - October 5, U.S. outages dropped sharply to 132, representing a 23% decrease from the previous week. This decline mirrored the broader global trend of reduced network disruptions.
- Over the two-week period from September 22 - October 5, the United States accounted for 56% of all observed network outages, continuing to represent a majority of global network disruption activity.
Month-over-month Trends
- Global network outages increased 18% from August to September 2025, rising from 1,117 incidents to 1,316. This uptick follows a historical pattern observed in previous years, as network activity intensifies when businesses and institutions resume full operations following the Northern Hemisphere summer period.
- The United States showed a more pronounced 41% increase, with outages climbing from 517 in August to 730 in September. This seasonal pattern has been consistently observed in prior years.
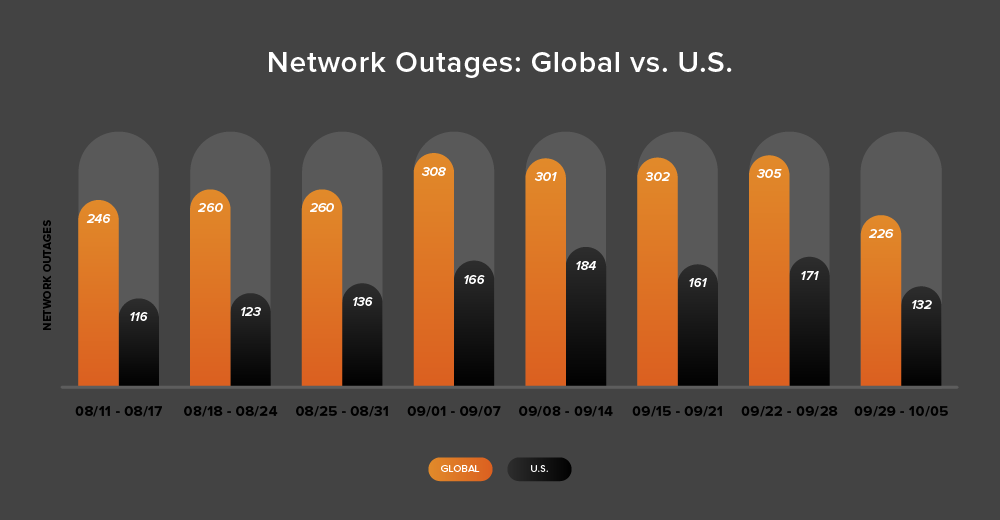
Figure 11. Global and U.S. network outage trends over eight recent weeks