This is The Internet Report, where we analyze outages and trends across the Internet, from the previous two weeks, through the lens of ThousandEyes Internet and Cloud Intelligence. I’ll be here every other week, sharing the latest outage numbers and highlighting a few interesting outages. As always, you can read the full analysis below or tune in to the podcast for firsthand commentary.
Internet Outages & Trends
In the world of incident tracking, we often wind up analyzing “lights on/lights off” scenarios, where a functioning service effectively disappears from view: page objects fail to load; backend requests for data go unfulfilled; users see static or dated content in cache, or potentially just an error code.
From a monitoring and diagnosis point of view, these types of incidents tend to be relatively straightforward. Because of the widespread nature of the impact, the responsible provider will likely put their hand up and take responsibility.
This contrasts with incidents that manifest to users as intermittent issues. Some users may experience error notifications and conditions, while others see regular service. When reported to support desks, the error message and conditions can be hard or impossible for engineers to replicate because, in isolation, they lack the full context. Internal telemetry may also show that the system is functional. Given all this, it is often easy for a provider to assume isolated reports are just local issues with specific customer setups, as opposed to something being wrong on the provider’s end.
Which, of course, speaks to the challenge. Degradations and intermittent faults are incredibly hard to find because the service is both working and not working simultaneously—or, it may just be slow, inconveniencing users and impacting productivity.
In this episode, we’ll examine two recent incidents that manifested as intermittent issues: one that impacted access to multiple Meta services for some users, and another that left a subset of Salesforce users experiencing degraded service performance.
When an intermittent problem occurs, it’s important to quickly determine where the issue lies. Continuous monitoring and visibility of the end-to-end service delivery chain enables a complete understanding of which part of the chain is causing an issue. It’s only by looking at signals from across the delivery chain together and in context that the root cause becomes apparent.
In addition to these intermittent issues at Meta and Salesforce, we’ll also look at an automation bug at Google Cloud that caused problems for a range of customers.
Read on to learn about all the outages and degradations, or use the links below to jump to the sections that most interest you:
Meta Disruption
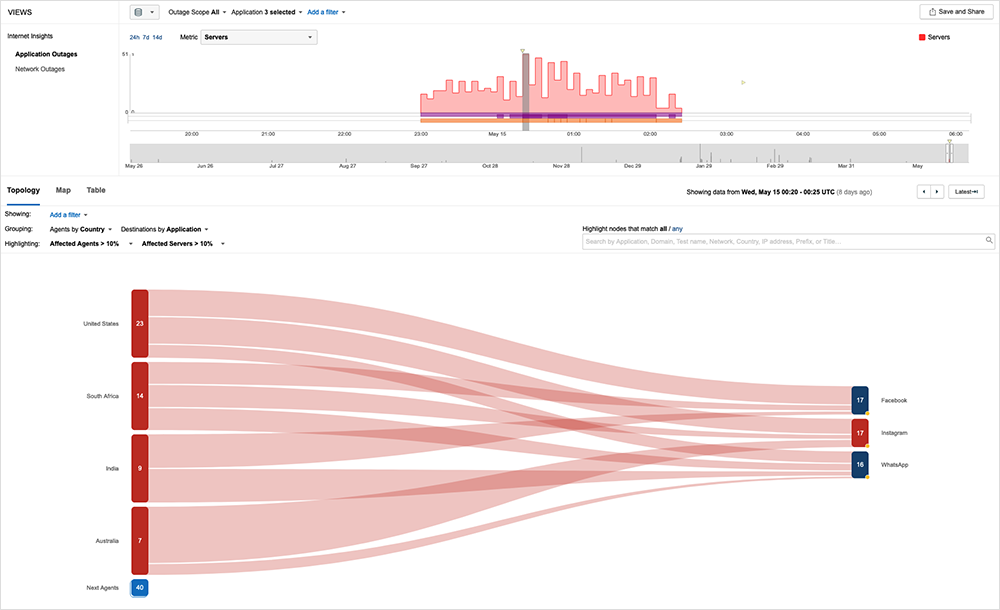
On May 14, starting at approximately 11 PM (UTC) / 4 PM (PDT), some users of Meta services—including Facebook, Instagram, and others—experienced a 3.5-hour disruption.
Throughout the incident, which appeared to impact a subset of users around the globe, ThousandEyes observed that Meta’s web servers remained reachable, with network paths clear and web servers responding, indicating a backend service issue was the likely cause.
What’s interesting here is the “castellation pattern” that we see when we explore the disruption in the ThousandEyes platform. The timeline (see Figure 1 below) showed impacted servers, and the fact that the number of impacted servers varied and fluctuated gives some indication that this was an intermittent issue. In other words, impacted servers appeared to recover, becoming reachable, and then degraded again.

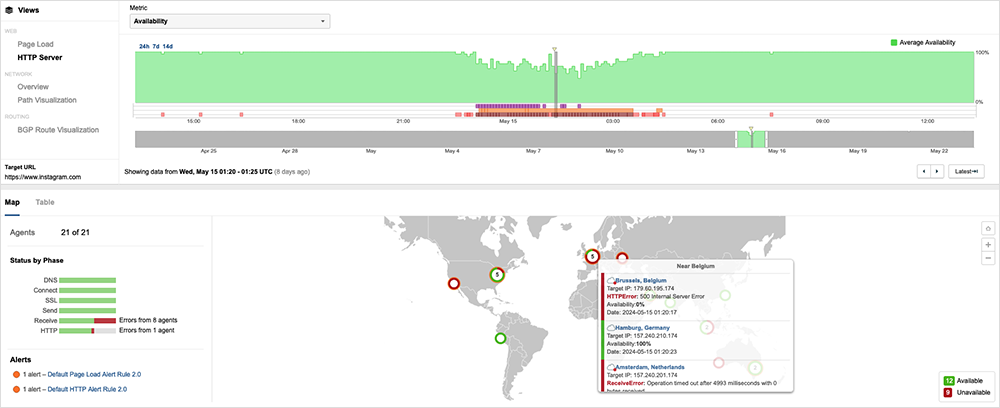
It seems like there were issues at the HTTP layer. ThousandEyes noticed that services were available from some locations while others were not. Additionally, ThousandEyes observed errors at the receive and HTTP layers, indicating that the problem was most likely with a backend service that is shared or foundationally common to these Meta services.
During the incident, there also appeared to be increased page load time. In past episodes, we’ve observed that a reduction in page load times is often indicative of a degradation—caused by the page having trouble reaching a backend service to retrieve all the information or load content objects it needs. However, in this case, the opposite appeared to occur—with page load times increasing instead. This still indicates a degradation, albeit a different type: one in which the system waited to complete the page, and, if it couldn’t, it then timed out.
Looking at the HTTP layer, ThousandEyes saw a series of timeouts interspersed with some requests returning HTTP 500 errors. The timeouts appeared to manifest as “Sorry, something went wrong” messages for some users. It is also important to note that there were also a series of 200 OK responses where everything appeared to be operating as normal.

That mix of responses further suggests that the issues were intermittent and unevenly felt by Meta users. It was an unpredictable experience, where users might hit a slow load or timeout; but if they refreshed the page or tried again, they might find the page loading as normal and working correctly.
Salesforce DNS Disruption
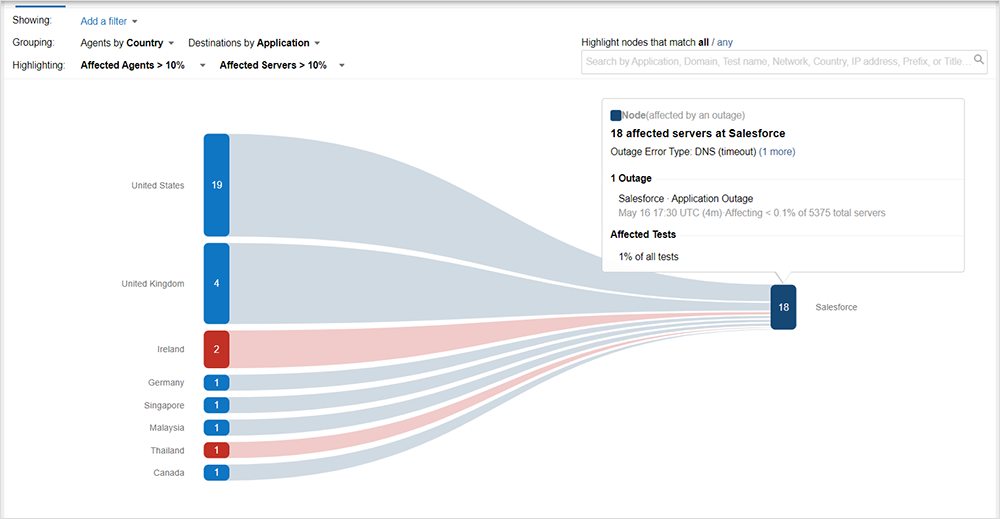
Salesforce also appeared to experience intermittent issues recently. Around 4 PM (UTC) on May 16, ThousandEyes began observing DNS failures impacting some customers attempting to reach some Salesforce services. The issues appeared to be impacting affected customers intermittently.
Salesforce identified the cause of the issues as “intermittent failures from a third-party DNS service provider.” Salesforce declared the issue fully resolved as of 8:30 PM (UTC).

When examining this outage, it’s also important to note that although the disruption impacted some of the name resolution times, from an availability perspective, there were no issues with Salesforce itself nor with any of its services.
This is why it's important to be able to understand and view telemetry data in context. There are a number of key challenges with identifying intermittent issues. Firstly, the fact that they are not happening all the time means that you need to be able to continuously monitor the system. Snapshots of single moments in time are likely to miss the issue. Secondly, you need to view and understand how different signals relate and interact with each other. It could be the case that, in isolation, all signals show the service is functional, but when viewed together in context of each other, you can more quickly identify the responsible party or domain. Taking this approach could have helped immediately surface that the problem was not with Salesforce but instead was with a third-party connected to the Salesforce ecosystem.
Google Cloud Issues Impact Spotify, GitLab, and More
Transitioning from the discussion of intermittent issues above, let’s explore one more recent disruption, this time at Google Cloud. On May 16, Google Cloud experienced network connectivity issues globally that impacted 32 services and had flow-on impacts to major SaaS companies.
During the incident, new virtual machines were created without network connectivity, virtual networking configurations could not be updated, GKE nodes experienced failures, and there was "partial packet loss" for some VPC network flows—among other effects.
Unlike the Meta and Salesforce incidents, the impact was not intermittent. However, just as the Salesforce disruption was caused by a third-party provider, the Google Cloud incident affected several other companies that rely on its services.
Shopify was one. It said in a status notification that “some merchants and customers are encountering error messages with admins, checkouts, storefronts, and retail.” The company attributed its issues to Google Cloud: “This is due to an issue with Google Cloud experiencing severe packet loss. The error will appear as a 500 error.” Problems lasted for up to one hour and 45 minutes.
GitLab initially saw issues with two Google Cloud-hosted nodes that manifested as 503 errors for projects using those nodes. It managed to mitigate the issues by restarting both nodes, after which it became apparent that the problems were caused by a more widespread Google Cloud issue, based on GitLab’s detailed chronology of its incident response.
CockroachDB and its users were also impacted for about 80 minutes. “We are aware of an ongoing Google Cloud Platform networking issue. This is impacting a select number of GCP Cockroach Cloud clusters,” it said.
Google Cloud’s preliminary post-incident report suggests the issue was due to a bug in maintenance automation. The automation was meant to shut down “an unused network control component in a single location.” Instead, it shut down the component “in many locations” where the component was in active use. Use of the automation has been “terminated” pending “appropriate safeguards [being] put in place.”
By the Numbers
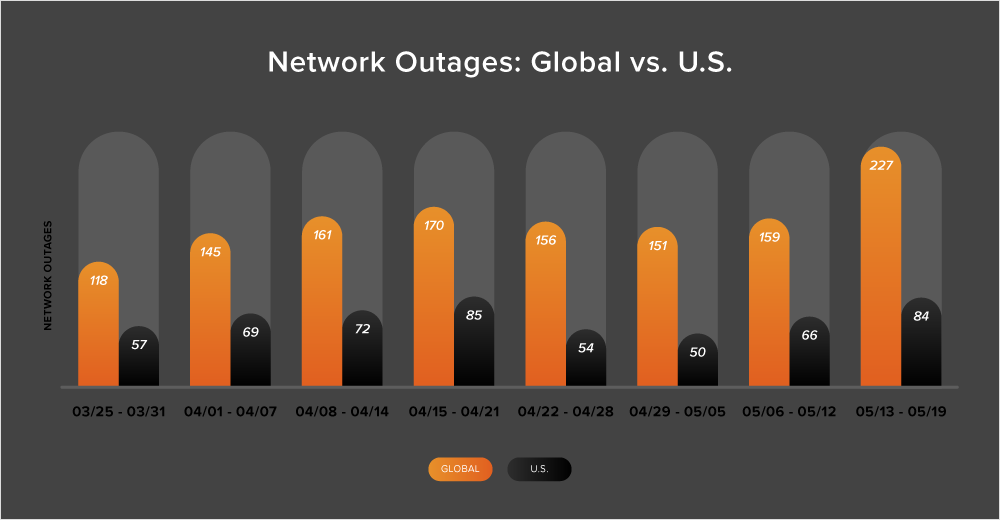
In addition to the outages highlighted above, let’s close by taking a look at some of the global trends ThousandEyes observed across ISPs, cloud service provider networks, collaboration app networks, and edge networks over the past two weeks (May 6-19):
-
The downward trend in global outages observed at the end of April reversed as we headed further into May. From May 6-12, there was a 5% increase in outages compared to the previous week, with outages rising from 151 to 159. This trend continued in the following week (May 13-19), with the number of outages increasing by 43%.
-
The United States followed a similar pattern, experiencing a 22% increase in outages from May 6-12, and a 27% increase the next week (May 13-19).
-
Only 39% of network outages occurred in the United States from May 6-19, continuing a pattern also observed during the prior fortnight (April 22 - May 5) where U.S.-centric outages represented less than 40% of all observed global outages. This is only the second time this year that ThousandEyes has observed this trend for two consecutive fortnights.
