This week on the Internet, total outages continued the upward trend seen over the past few weeks, increasing by 8% when compared to the previous week, and 40% since the beginning of November. The bulk of the increase seen this week was made up of ISP outages, which increased 11% when compared to the previous week. These increases seen globally were not reflected domestically with both total domestic outages decreasing by 6% and ISP outages similarly decreasing by 12% compared to the previous week.
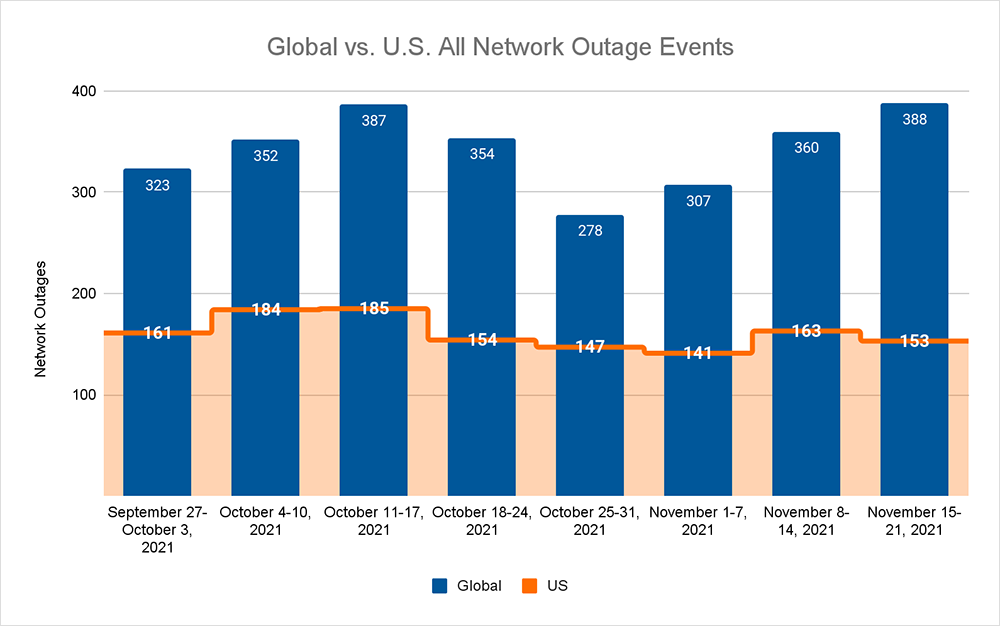
In my mind, the simplest explanation for this is Thanksgiving. As the country that is home to the largest portion of Internet infrastructure and connectivity prepares for its annual long weekend holiday, engineers are likely to be getting a lot of maintenance and other network infrastructure works out of the way in preparation.
This resulted in a lot of what appear to be maintenance-related outages averaging 10 to 15 minutes; slightly longer in duration than we’d normally see in our weekly numbers, but with more occurring out of hours. This is indicative of a lot of engineering work being performed in advance of a period when networks are likely to receive a workout for leisure and shopping purposes.
There was one “major” incident this week in the form of a configuration change made by Google that failed to propagate correctly and caused issues with its cloud-based load balancers worldwide.
It briefly led to a host of big name online services—the likes of Spotify, Discord, Snapchat and Etsy—becoming inaccessible and throwing up HTTP 400 server errors, in response to user requests. These accessibility issues were unevenly felt, with some users reporting problems, while others did not. Most impacted applications seemed to recover in under 10 minutes.
The downstream impacts of the load balancers not working fits my—indeed, most user’s—definition of what an outage is, as users tend to think of an outage as any time they start feeling pain in a digital experience or interaction. From a regular Internet user’s perspective, some sites were unusable, and so this would have registered as an outage in their minds.
But this is a weekly column that explores connectivity issues: between data centers, along major transit and interconnection routes or in last-mile fixed infrastructures. And, well, this wasn’t one of them.
This was an issue with load balancers disrupting availability. Internet users could still make their requests for content, and these were being relayed from the CDN to the load balancer for onward distribution to the application servers. The problem wasn’t with connectivity at any point in that chain, but instead with the load balancers being unable to process requests, which caused them to return service unavailable errors.
This might seem like a case of semantics, especially as some of Google’s own cloud engineers publicly referred to the incident as an outage, but it falls into somewhat of a grey area with respect to this particular column series, which focuses on network outages, and it was a good opportunity to explore it.
Not Every Change Works
The Google incident may point to a broader operational challenge: that is, in environments where there is a high frequency of changes being pushed out, inevitably not all of those changes will play nice, despite the amount of (often automated) testing of each release.
Deployment frequency is a standard metric to measure the success of DevOps teams, and it is relatively common these days for teams to be pushing new code to production—application updates, features, patches and the like—multiple times a day.
Google Cloud actually does its own research in this area, which found 26% are deploying on-demand, multiple times a day. Incredibly, “elite performers deploy 973x more frequently than low performers.”
The research also deals with change failure rates, defined as “the percentage of changes to production … [that] result in degraded service (e.g., lead to service impairment or service outage) and subsequently require remediation (e.g., require a hotfix, rollback, fix forward, patch).” Even the most elite developers see a change failure rate of up to 15%.
That’s just the changes you control. If your product pulls data from third-party APIs, the API owner is under the same pressure to change frequently to introduce new features or optimize performance.
While there are likely to be various contractual terms in place requiring them to notify you of impending changes, they may also make changes you don’t know about—that is, until your service stops working. That’s why API monitoring is an important part of the broader suite of visibility tools employed by application owners to monitor all aspects of operation and performance.
The point is, even the best teams in the world, with the best tools and practices, won’t get every change right. Application owners need to independently maintain their own visibility across this dynamic environment in order to recognize potential causes of degradation to their own services, and be best-placed to escalate them for resolution.