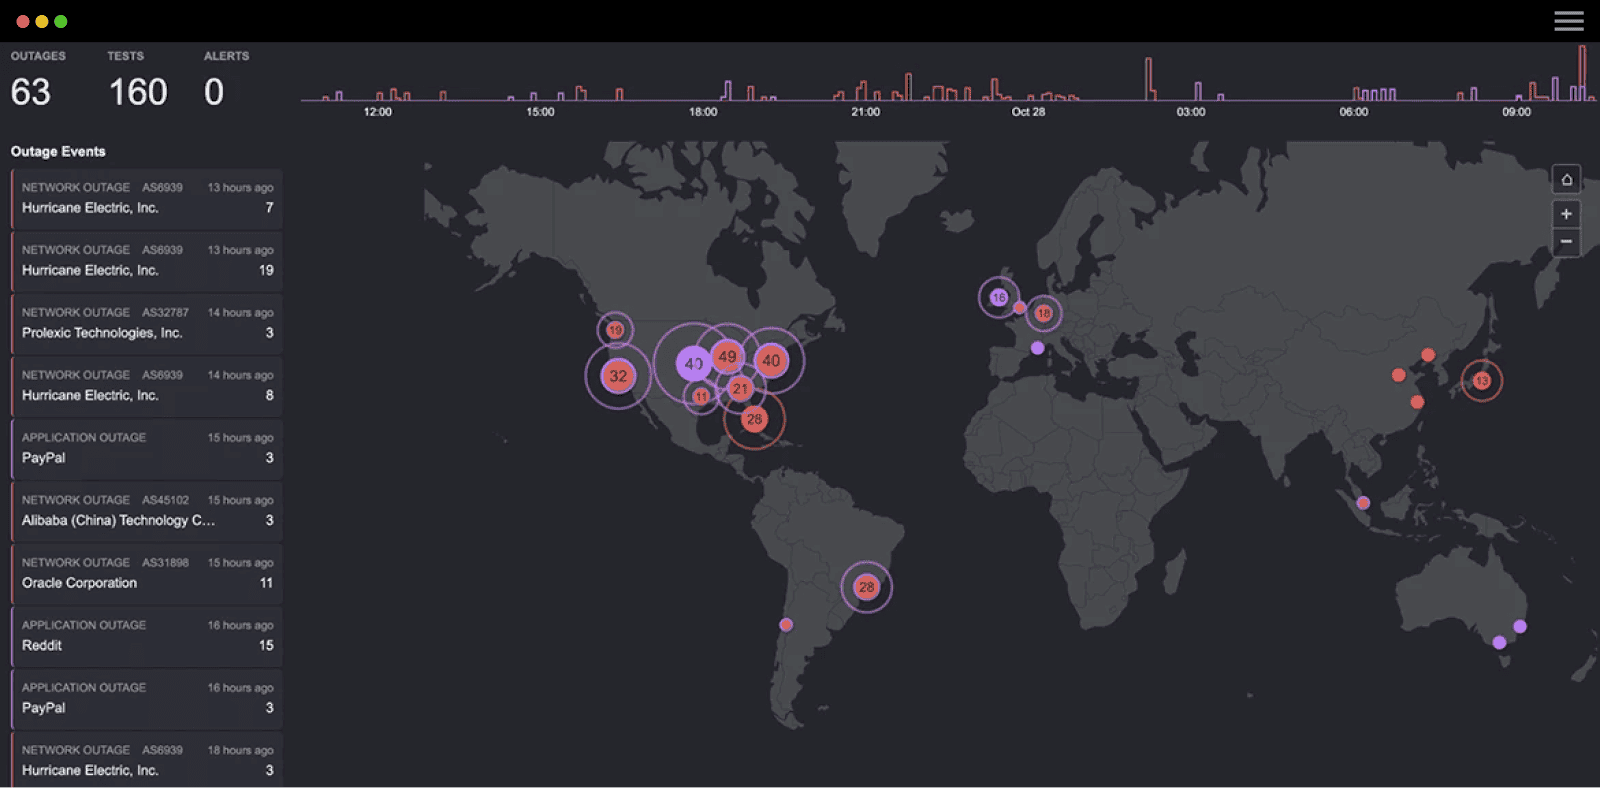
Accessing multiple web services has become ingrained into lives of millions around the world. As soon as one of these services goes down, everyone complains in whatever outlet they can, evidenced by the Facebook and Instagram outage earlier this year. In an office environment, a member of the IT, Ops, or Network teams unfortunately becomes the sounding board for most of the complaints when SaaS tools and web services are slow or inaccessible. As more services become cloud-based, having an objective source for performance insights can lead to faster resolution of "Salesforce is down" help-desk tickets.
Along with cloud becoming the new standard, a significant amount of key websites are now relying on third-party services for data and richer user experiences; examples include APIs, CRM, CMS, marketing automation, email, analytics platforms and even payment gateways. When that dependent relationship exists, tracking availability of top SaaS and web services is fundamental to providing the best possible user experience and, in some cases, minimizing revenue loss as well.
To help with SaaS monitoring, ThousandEyes offers network performance data feeds for 19 of the most popular SaaS applications and web services:
- Sales & Marketing: Salesforce, Oracle OnDemand, NetSuite, Marketo, Microsoft Dynamics, Hubspot
- Collaboration: Microsoft Office365, Google Apps, Dropbox, Box, GitHub
- Finance & BI: SAP Business Objects, ADP, Concur, Docusign
- Consumer: Facebook, Twitter, Apple iCloud, LinkedIn
More than Just a Green Light
By sharing network performance data, ThousandEyes aims to provide more than just a green light that shows if a web service is up or down. As we discussed in our post The Evolution of Network Monitoring, "applications are now much more complex and dependent on multiple third-party components. Modern network monitoring solutions need to be application-aware and able to single out underlying problems that actually impact user experience." A status indicator is simply not enough anymore.
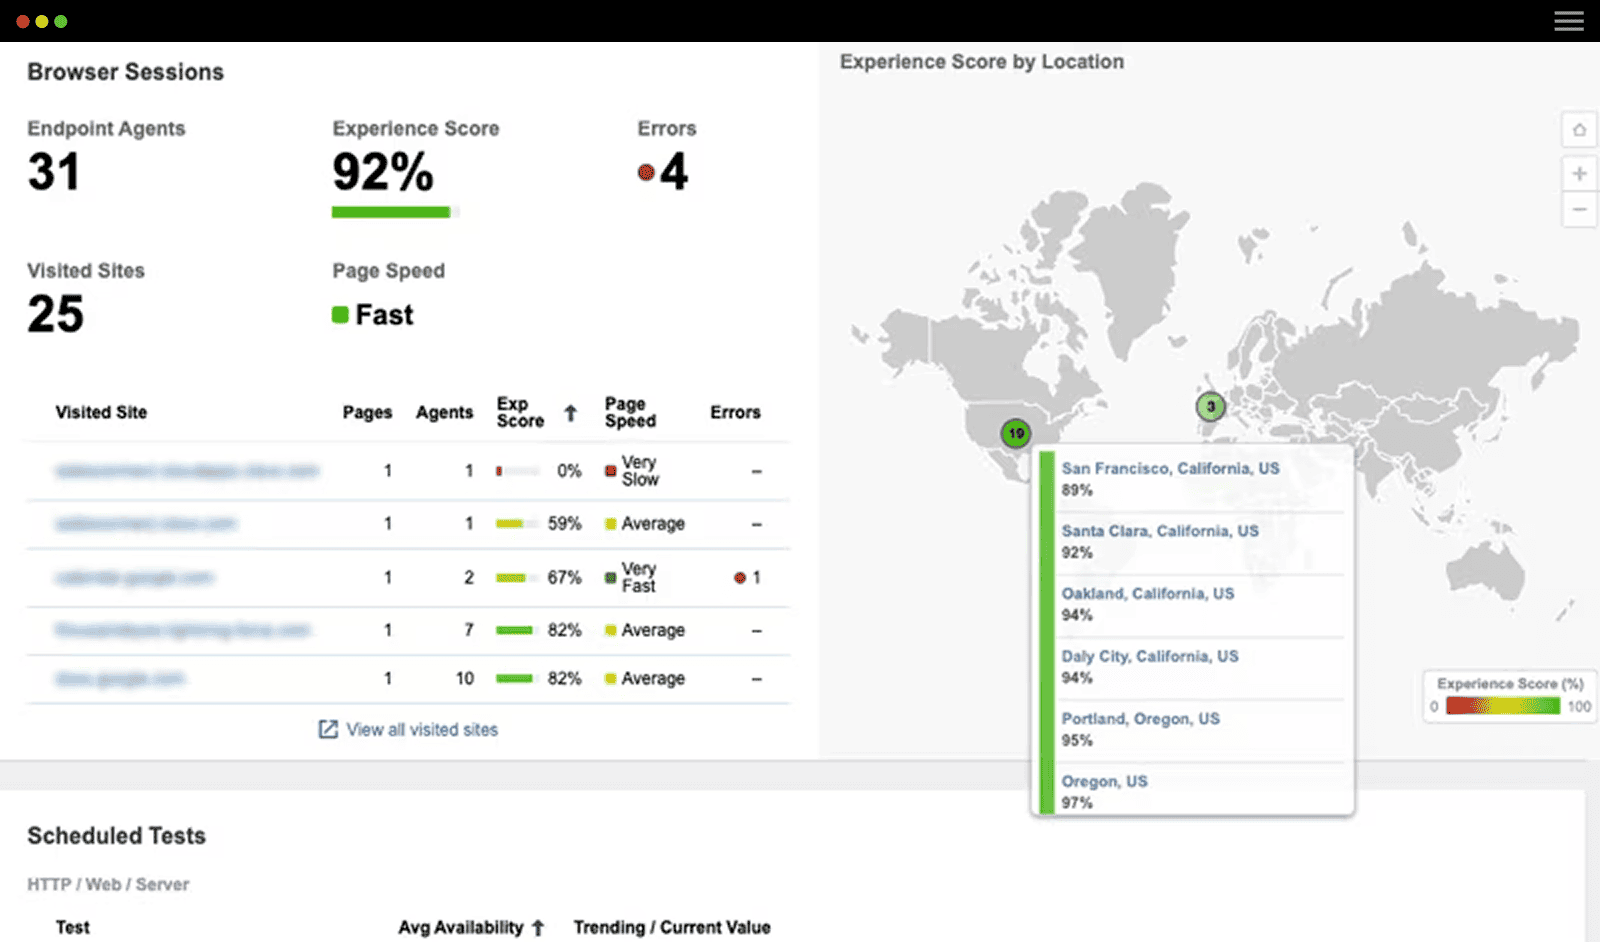
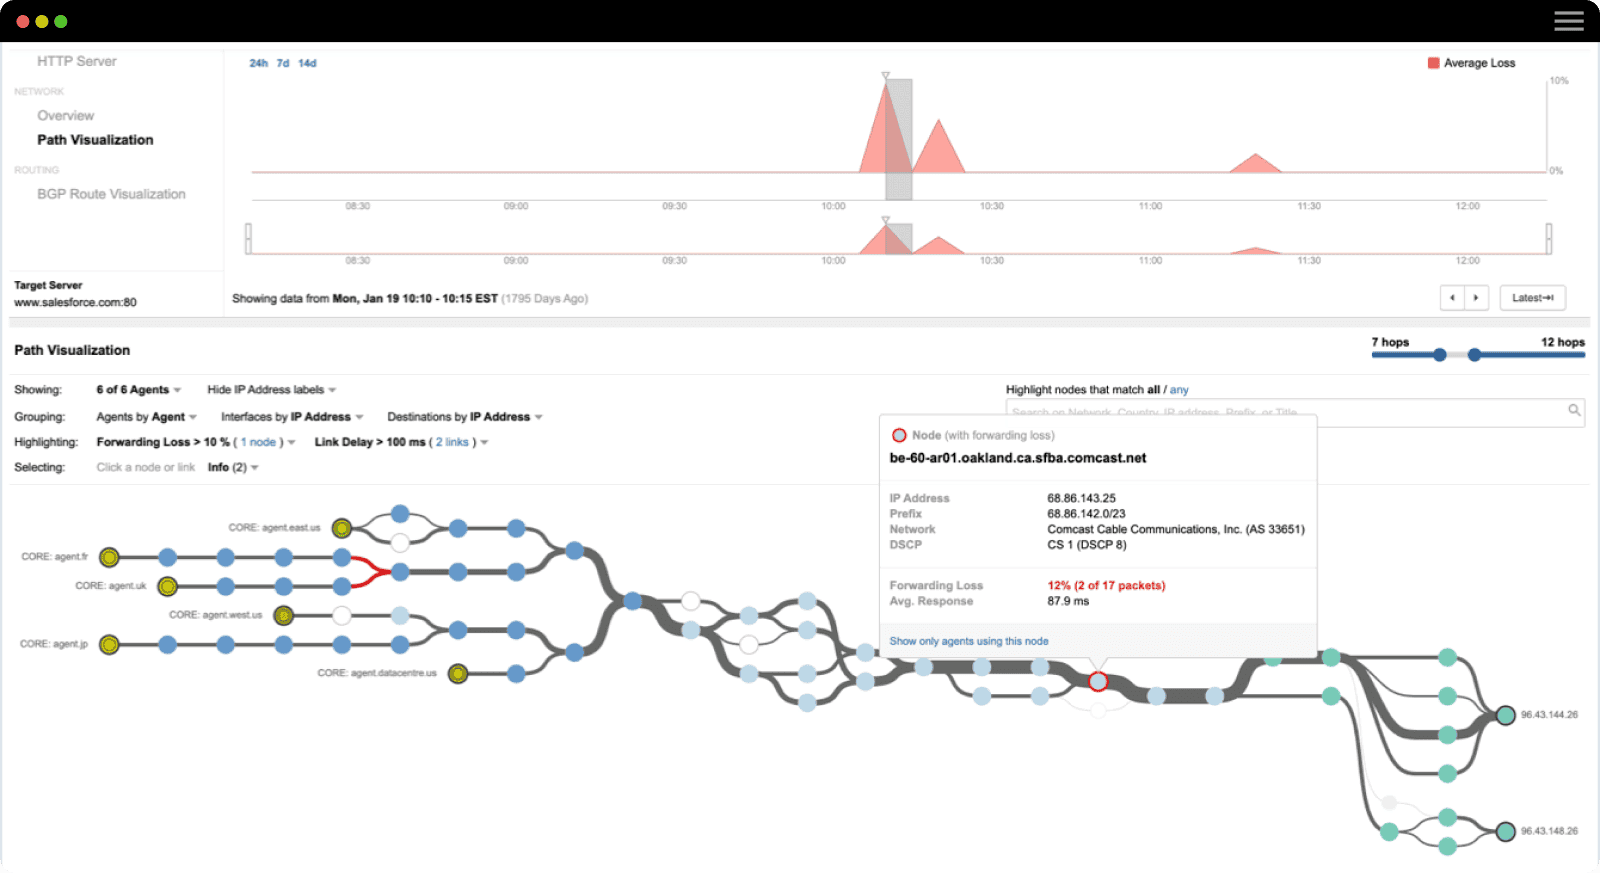
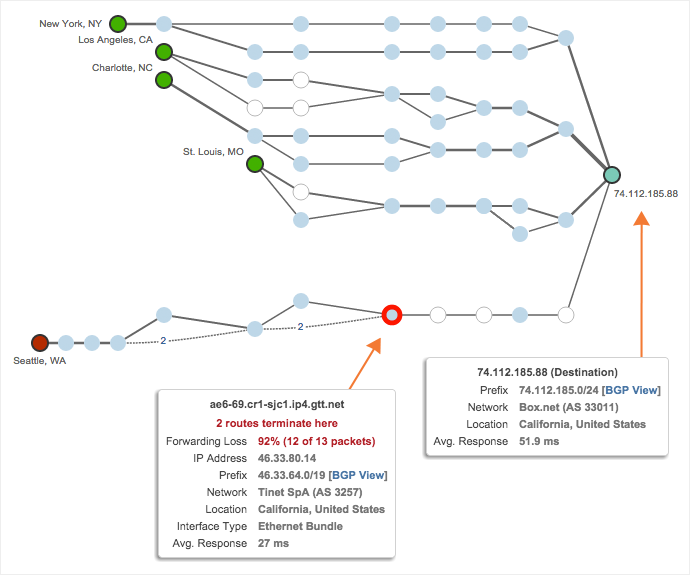
The granularity of network performance metrics collected by ThousandEyes allows for a much more comprehensive and accurate status check for top web applications when compared to isitdownrightnow.com, downrightnow.com or iswebsitedownnow.com for example. ThousandEyes collects data via our global Cloud Agents that simulate end-user traffic. With this data, SaaS monitoring includes not just availability and response time information, but also loss, latency, and jitter per network link and interface along each user path. So you’ll be able to understand if an outage or performance event is an application provider issue, a global service provider issue or something specific to networks in your region.
Enable network performance data for the web applications you care about. Sign up for a free trial of ThousandEyes today.
