ITOps teams are facing increased pressure to troubleshoot and resolve application and network issues faster. Simultaneously, leaders expect these teams to shift to a proactive mode of monitoring and optimizing IT systems to help them avoid problems altogether.
To help our customers meet these expectations, ThousandEyes collects billions of detailed measurements across various communication layers (i.e., network, HTTP, DNS, etc.) to give unparalleled visibility into their performance. By combining the metrics from these network tests, we provide practitioners with powerful correlations between different indicators that can help them troubleshoot any issue that arises as well as analyze performance patterns that can inform infrastructure improvements or changes.
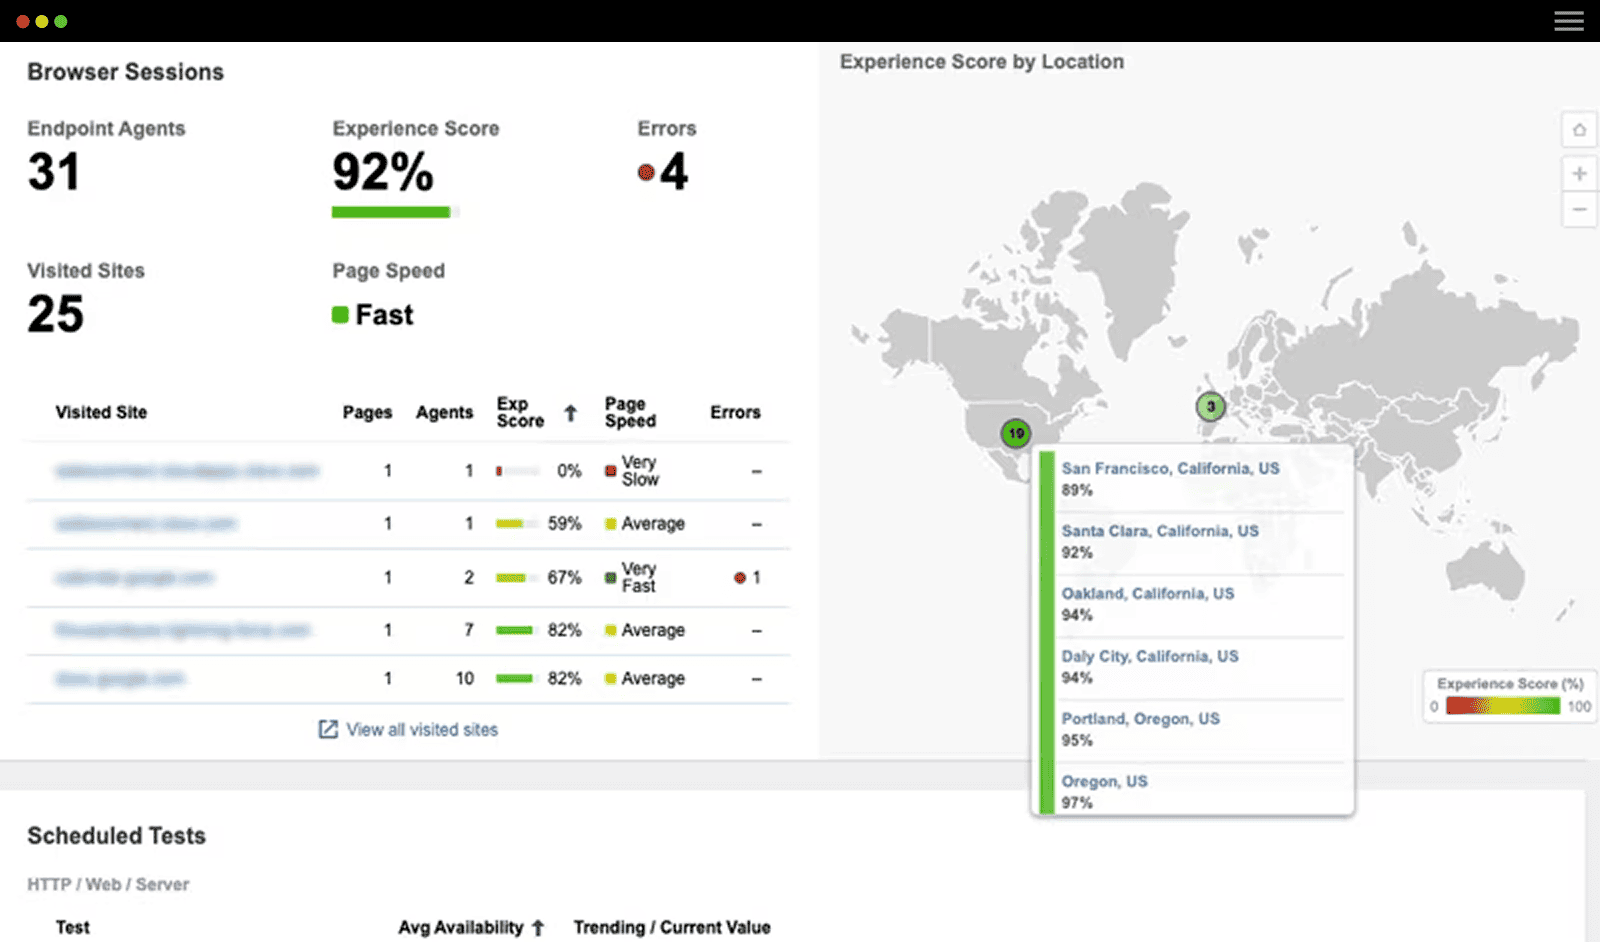
And in a major upgrade to how test data is consumed and visualized for users, we’re pleased to present Views 2.0 within the ThousandEyes platform. This feature is a complete redesign of the views page when looking at Cloud Agent and Enterprise Agent test data. Customers can enable it now within the UI with a single button (“Open Views 2.0”) and immediately begin using the new visualizations and interface filtering options with their existing tests and data.
Some of the new features you’ll notice when enabling our new views experience are:
-
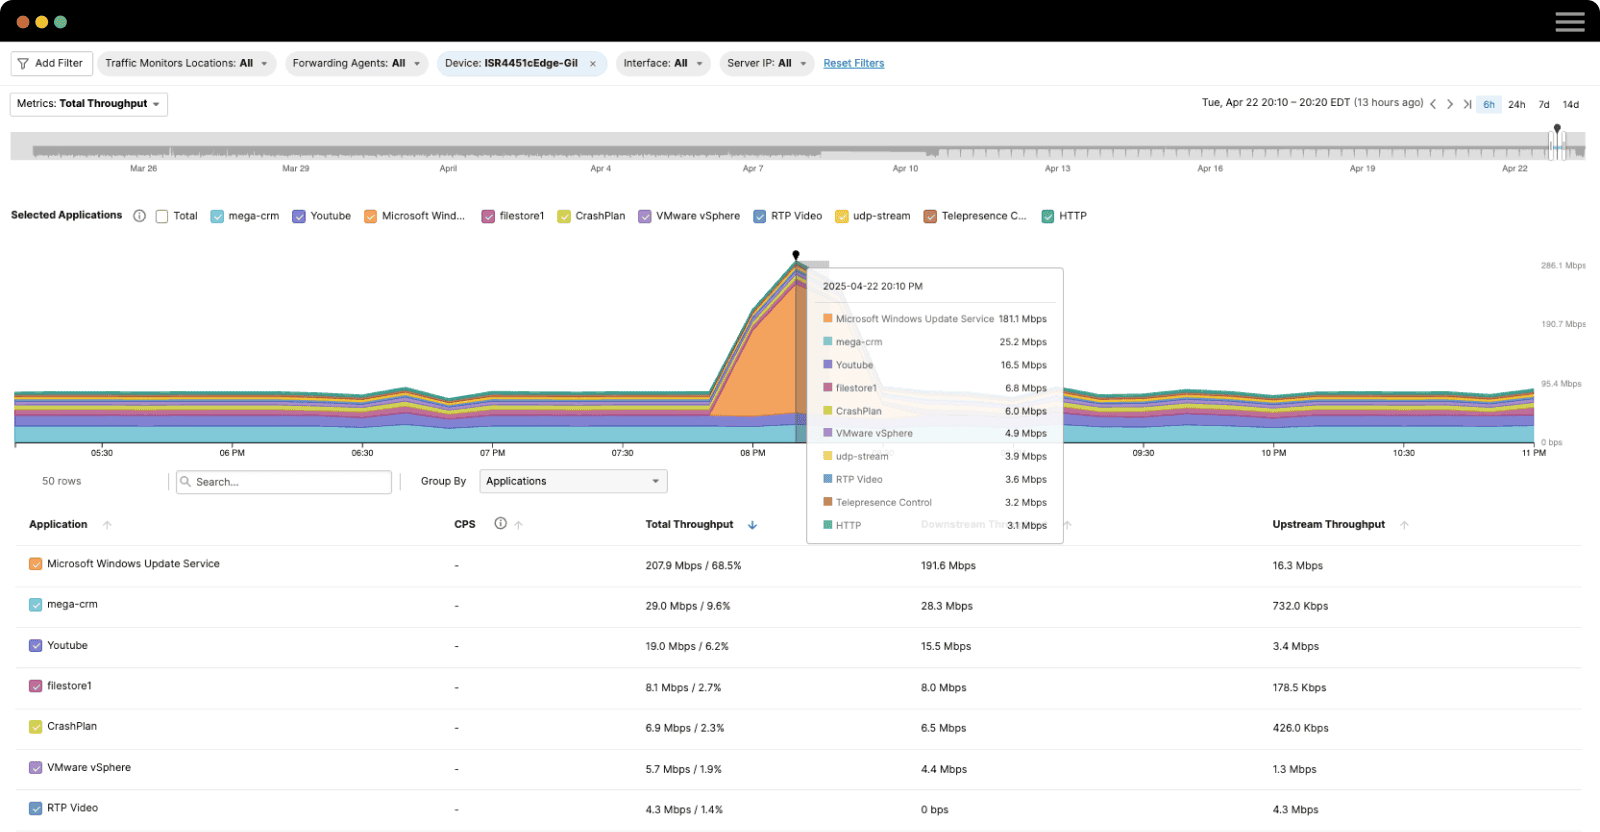
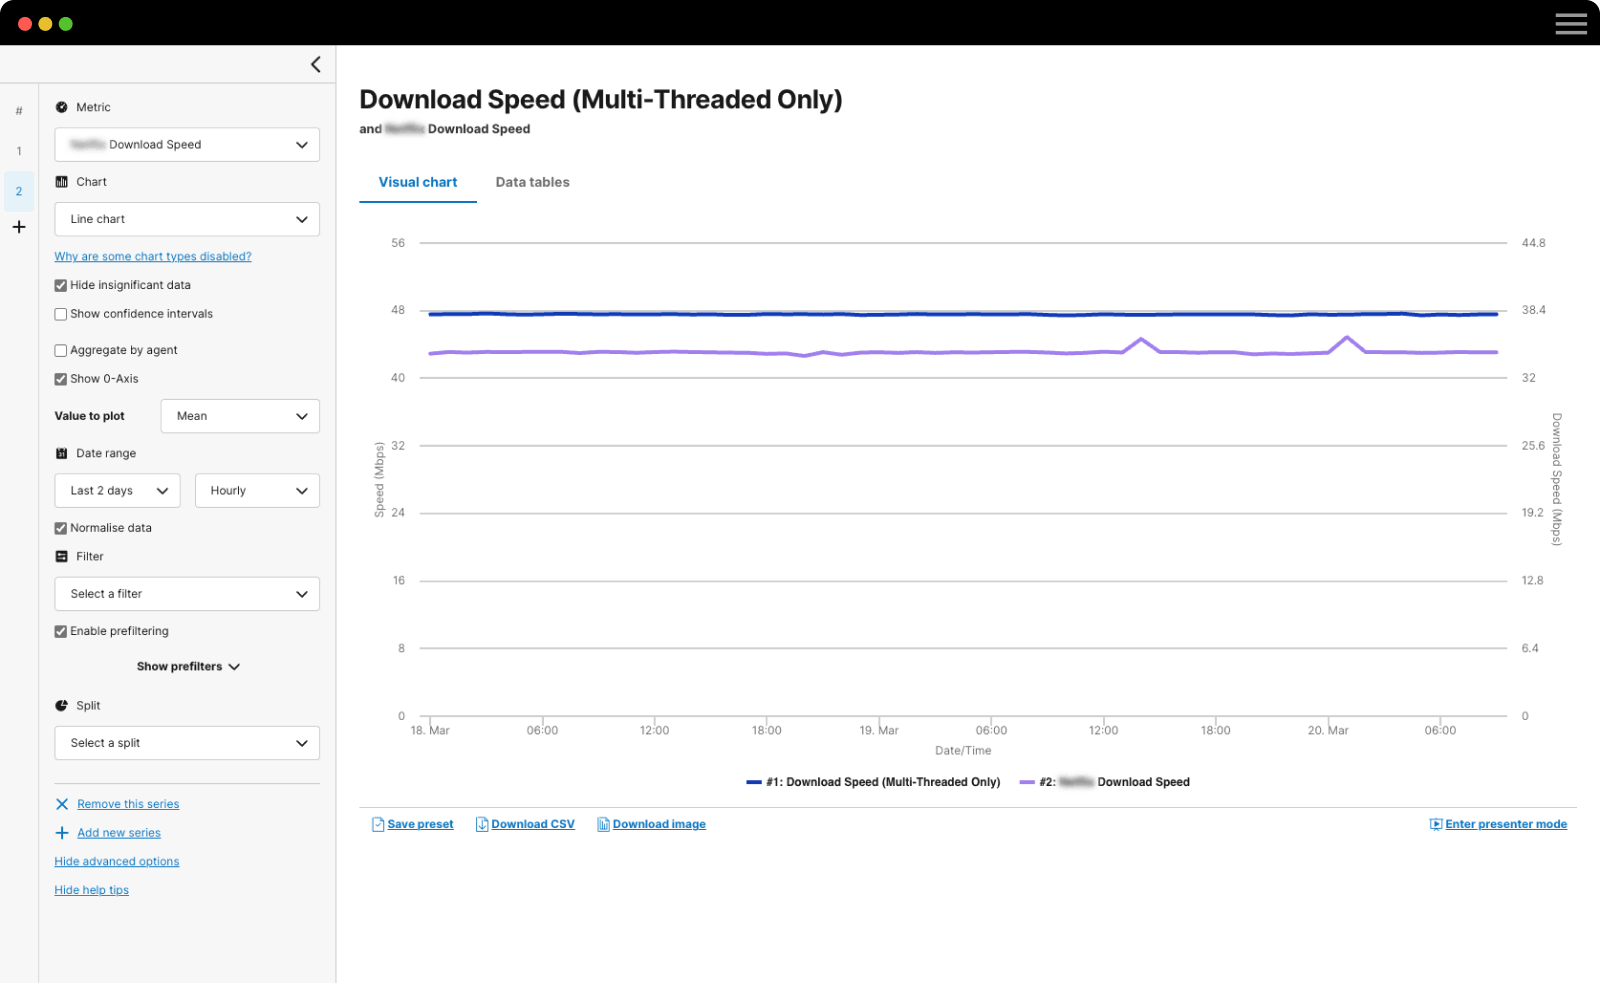
Multi-Metric Comparison: Views 2.0 lets you compare multiple performance metrics at once. You can easily spot trends, correlations, and anomalies across different measurements, empowering you to uncover deeper insights and make informed decisions like never before.
-
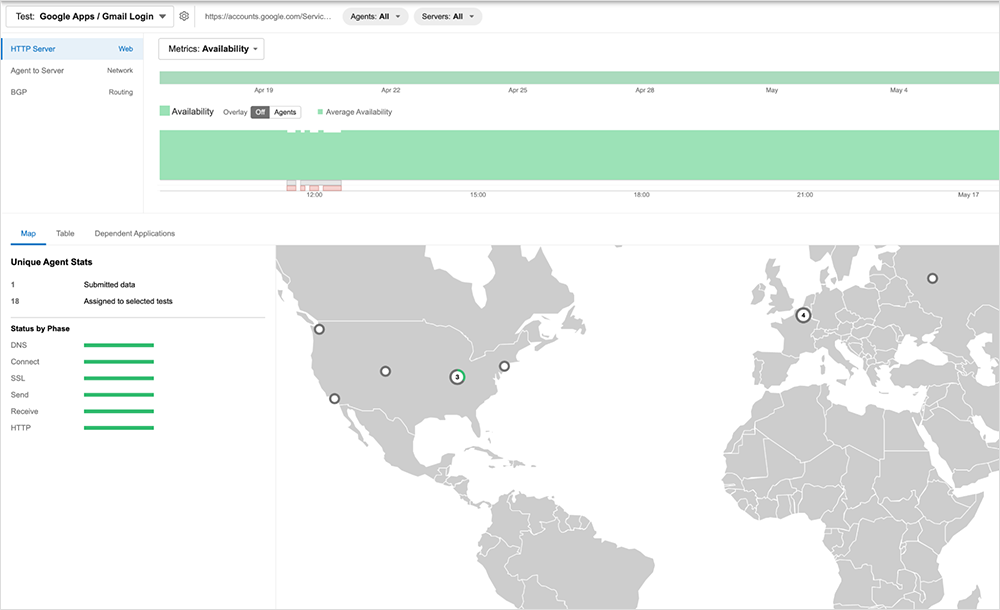
Agent Overlays on Timelines: We’ve made troubleshooting easier by introducing agent overlays on timelines. Now you can seamlessly correlate specific events with performance data collected by individual agents.
-
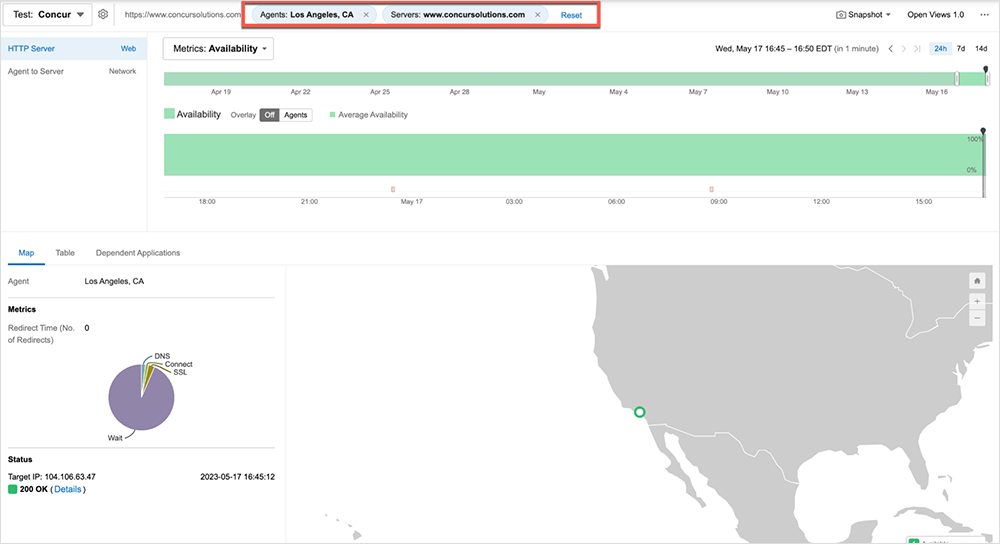
Global Filtering: Views 2.0 introduces a powerful global filtering feature. You can now apply filters across multiple views all at once, allowing you to focus on specific regions, test targets, or other criteria that matter most to you.
-
Round-by-Round Keyboard Navigation: Views 2.0 brings you round-by-round keyboard navigation. With just a few keystrokes, you can seamlessly navigate through different rounds of data, skip to the last round seen, and collapse menus to see what matters to you.
Let’s look at some examples where these new features already enable enhanced analytics and a better user experience.
Discover Application or Network Issues With Multi-Test and Multi-Agent Comparison
ThousandEyes tests that target individual components or URLs are great for gathering hop-by-hop network performance data between an agent and a destination. However, it is sometimes necessary to view data from multiple agents in different geographic locations or that target multiple destinations to get a complete picture of overall application health and performance. Previously, this meant going into various individual tests to check the data and then comparing those values across all the targets.
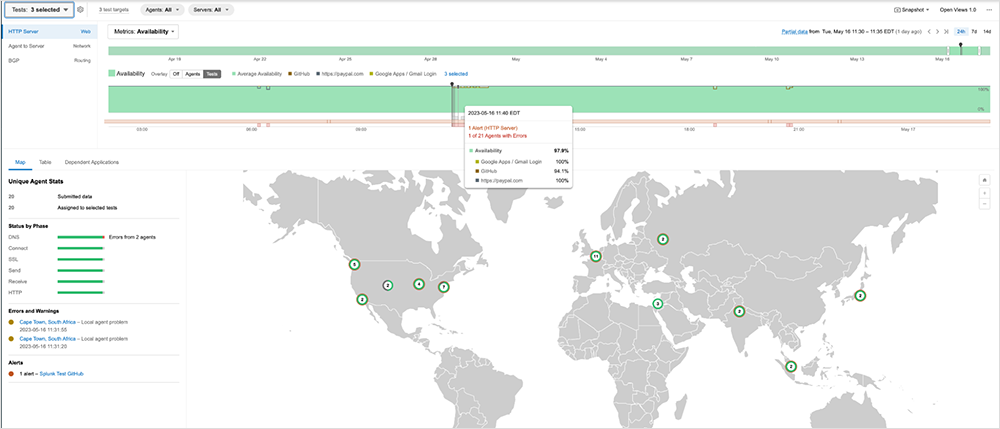
With Views 2.0, we have greatly simplified this workflow to allow you to quickly compare the data from multiple tests and agents within a single view. Customers can now display the overview results from a single test within a view and overlay individual results from multiple agents that were configured to run this test. This capability allows you to easily see your enterprise network’s overall performance so you can pinpoint any agents or portions of the network experiencing issues and contributing to an overall drop in performance.

Views 2.0 offers another useful option for understanding overall performance from multiple application components: the ability to display data from various tests in a single view. An application might have multiple front-end servers reachable at different URLs that need testing to get a complete picture of performance. In such a case, you can create a view containing all of the ThousandEyes tests that correspond to that application and see their results in timeline view for trending data and with more detail in table view. With this feature, you can see all the test results and compare them in one place.
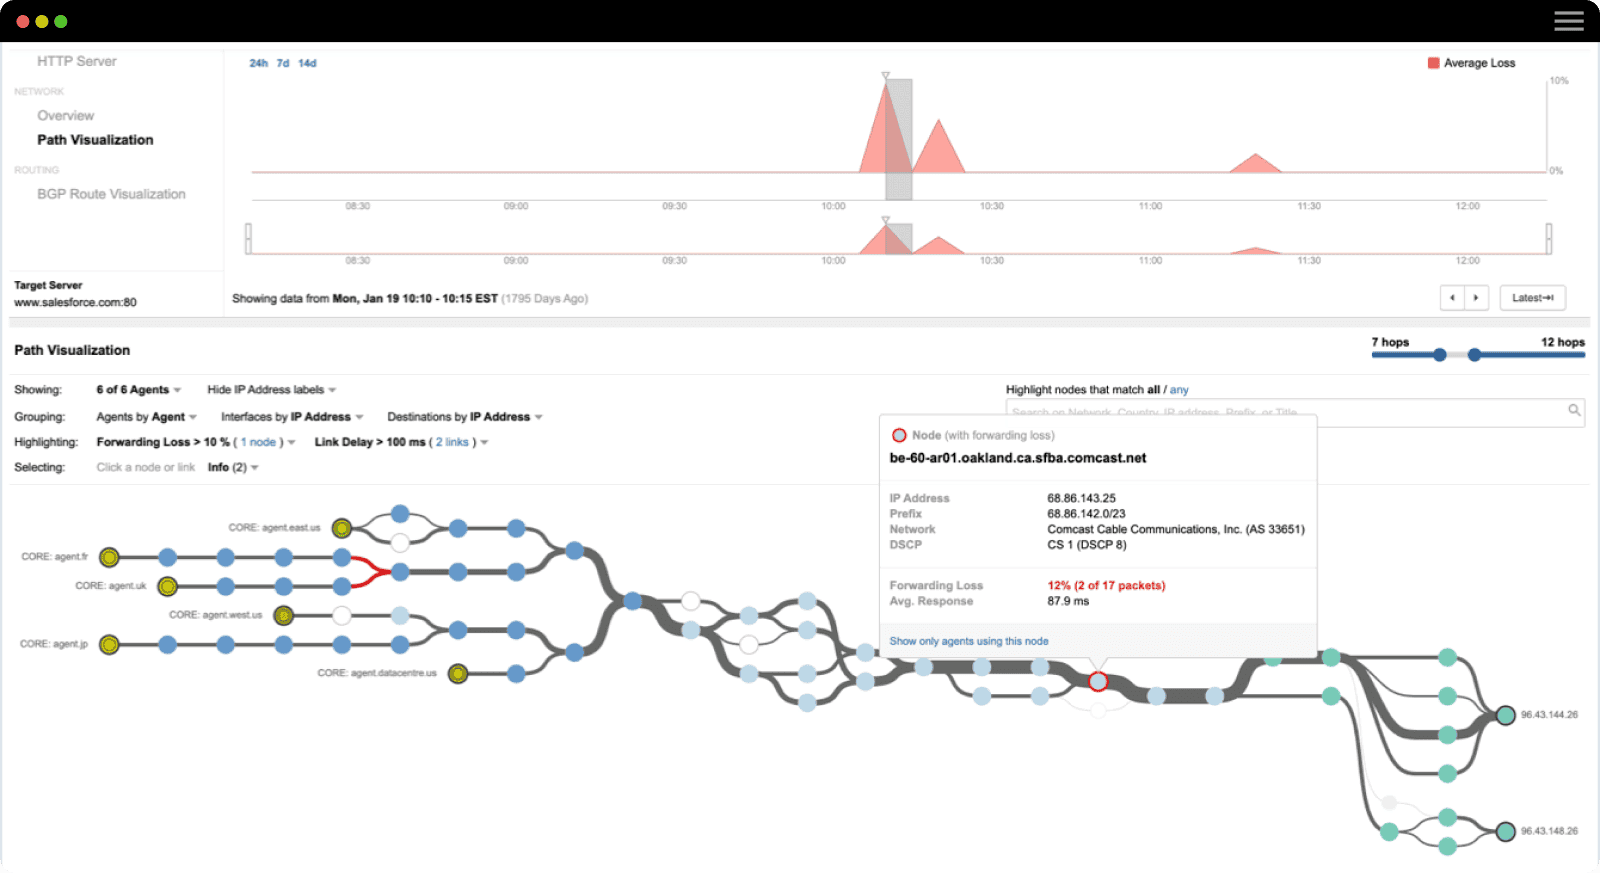
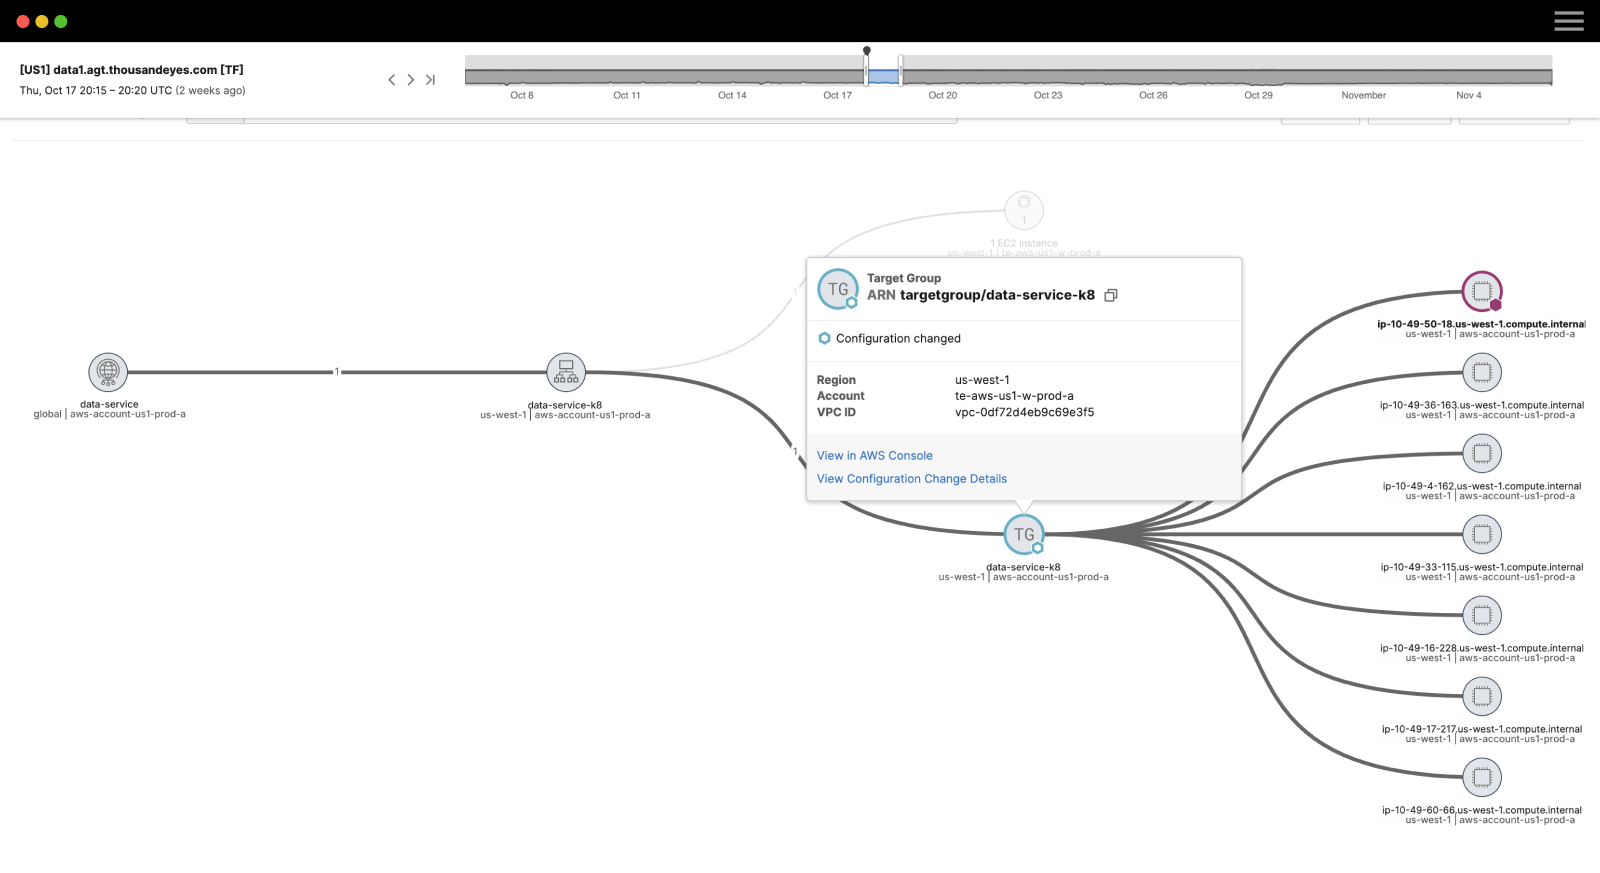
If your application depends on third-party APIs or services that require testing and performance comparison alongside your application URLs, this feature can also be quite useful. The multi-test view allows you to see the different components and performances associated with them easily. In addition, the path visualization capabilities within Views 2.0 will enable you to display the network path of multiple agents to multiple test target destinations. This capability gives you a visual indicator of where network problems occur along the path. It also shows if traffic is taking unintended routes to application components, which can degrade performance.
Multi-Metric Views To Correlate Data Points to Wider Issues
ThousandEyes lets you configure tests to determine the performance and connectivity of different network endpoints, URLs, and application components. For each test, you also can test different portions of the overall transaction, such as page load, HTTP, network layer, and BGP. These values alone are helpful point-in-time indicators of performance. Still, when used together, they can help tell a complete story of application performance and show when certain factors might be affecting the performance on the whole.
For example, when looking at the network layer, some key metrics to consider are loss and latency. When looking at the HTTP layer, response time and availability are important to track. With Views 2.0, you can gather all of these metrics within the same display and see if a problem with one area is affecting others. Those who do so might find that an upstream ISP issue has caused packet loss and connection latency to increase. By tracking this data in the same view as HTTP stats, you may also find that the overall availability of the application has gone down due to a degraded network connection. And this is just one example. Combining the viewing of any metric that ThousandEyes collects gives operations teams the ability to create customized views and correlate trends across the most relevant data to their application.

Improving Data Visualization and Enabling Faster Problem Response Times
In time-sensitive situations, it is crucial for responding teams or engineers to have access to the data they need to narrow down where a problem is occurring quickly. Through interface enhancements such as keyboard support for navigating the timeline view and global filters that save settings between tests, Views 2.0 gives teams improved operational efficiency and provides enhanced visual correlations during problem investigation.
These are just a few ways Views 2.0 can enhance your experience using ThousandEyes. It offers much better correlation and visualization capabilities, and you can test it out immediately with the data you are already collecting.
