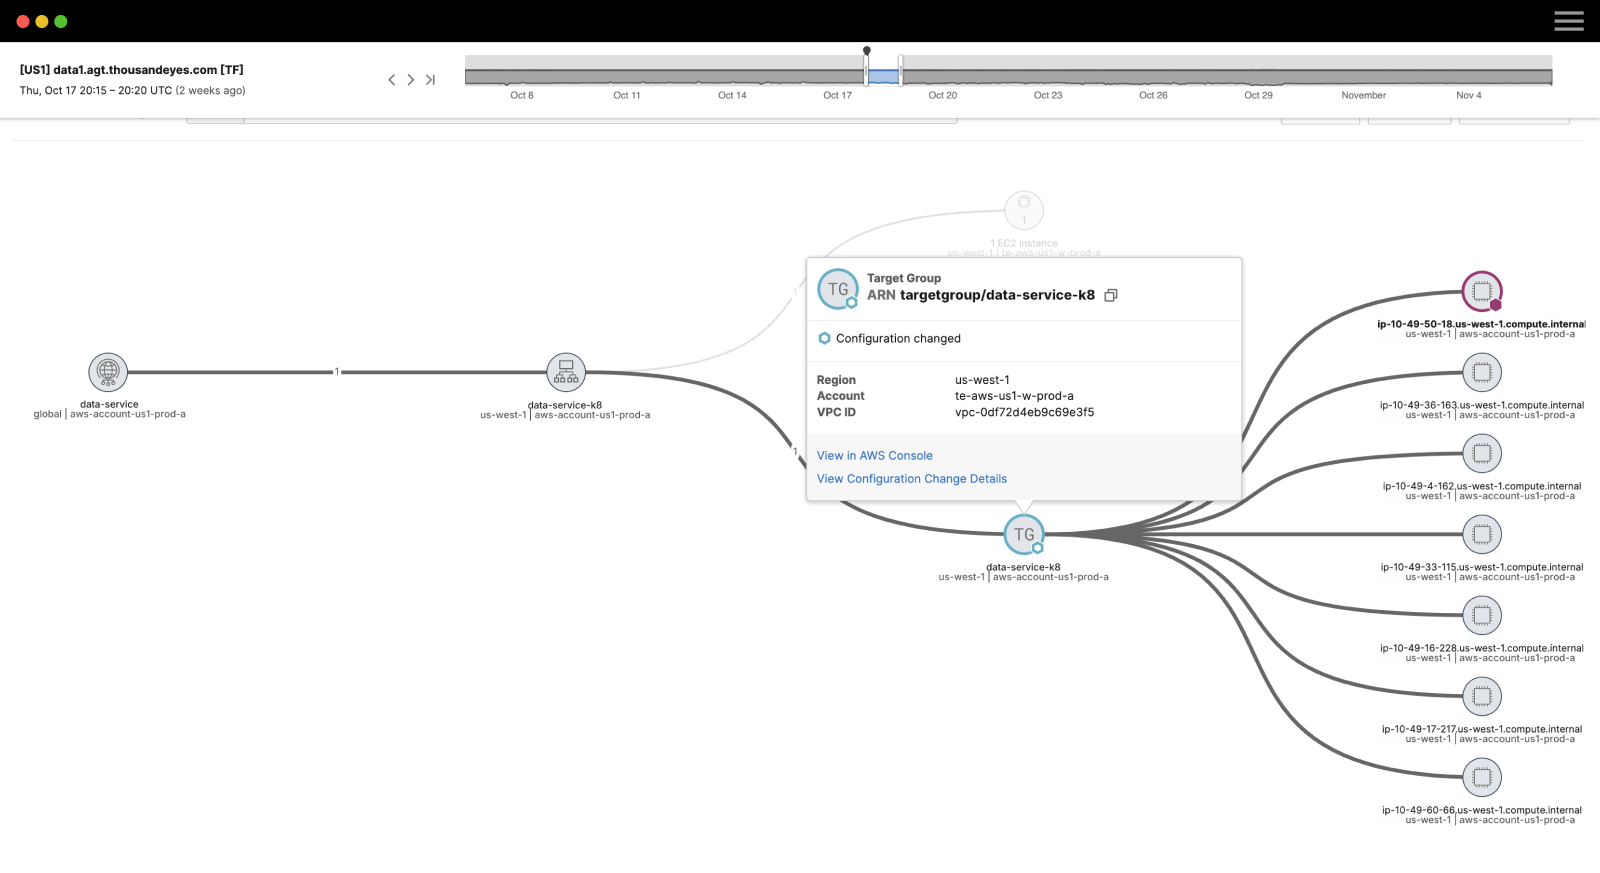
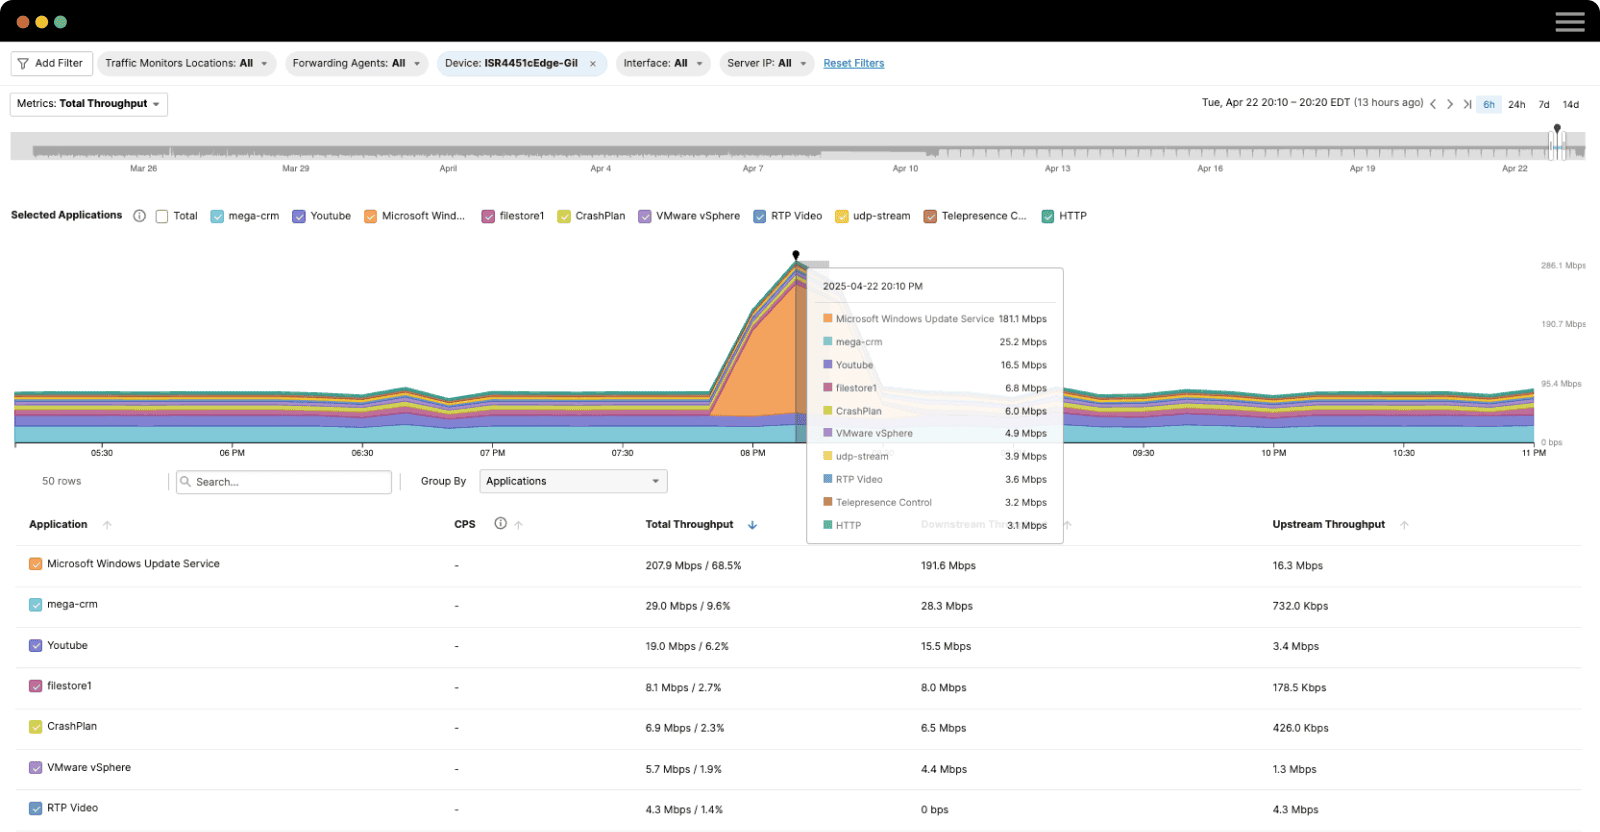
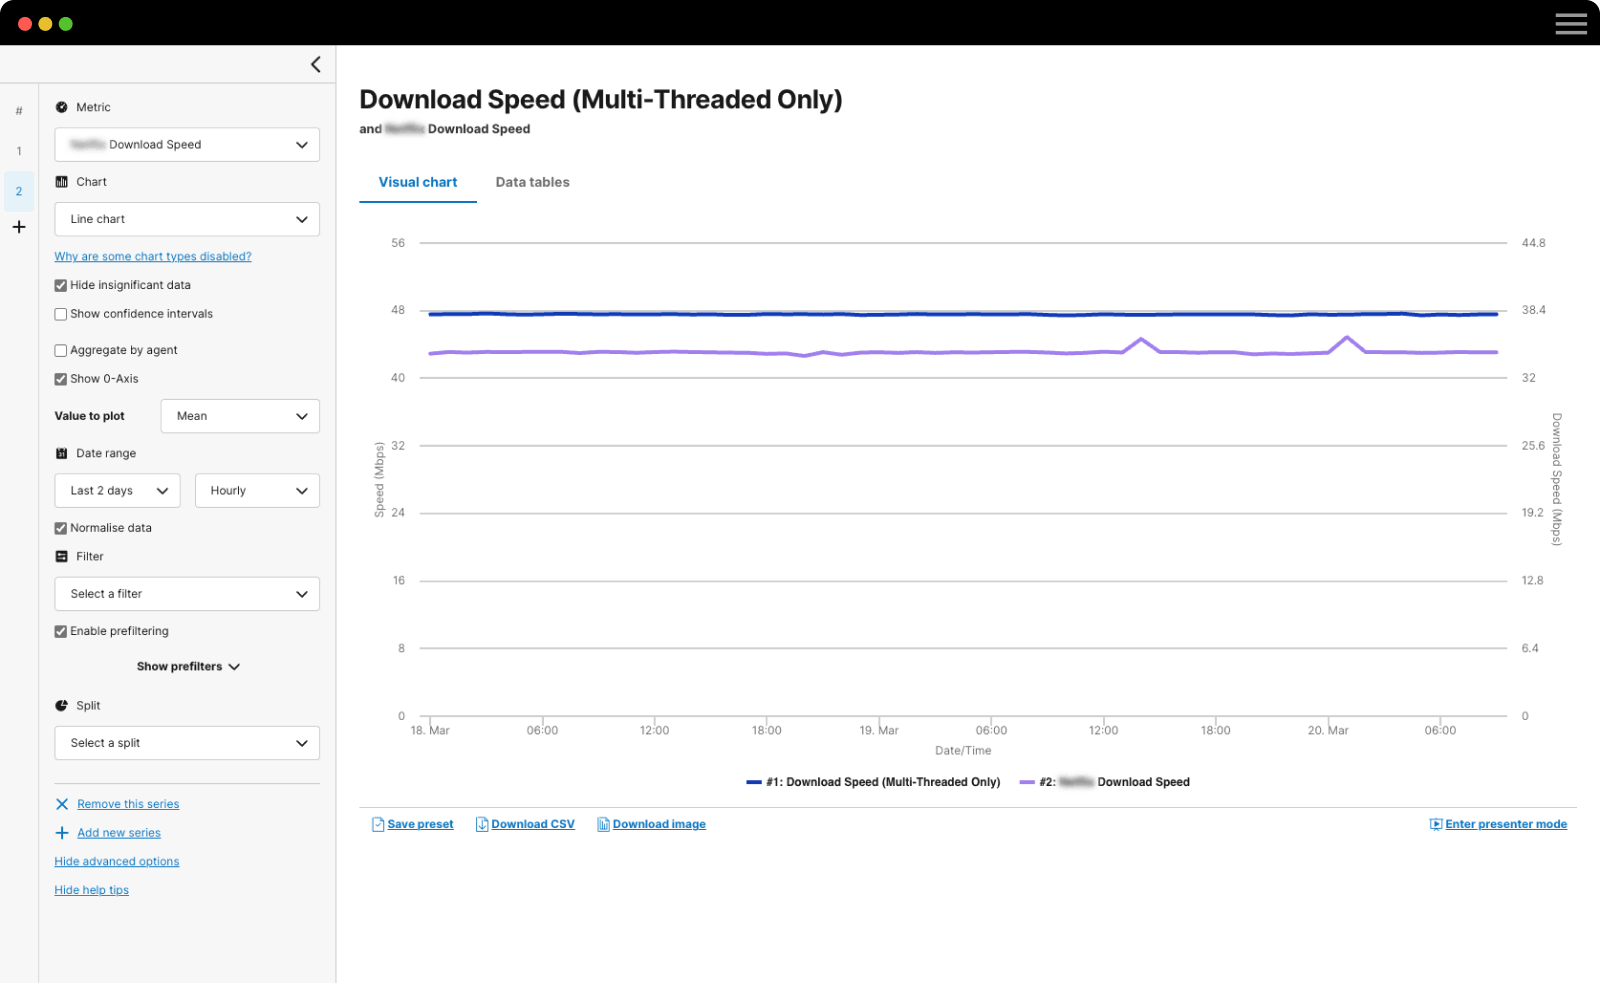
Welcome to the New Features Roundup, a blog series highlighting noteworthy enhancements to the ThousandEyes platform designed to increase the value customers can receive across various use cases.
At ThousandEyes, part of Cisco, we’re committed to providing you with the platform and products most capable of delivering the broad visibility and insights IT needs to optimize digital experiences across your end-to-end application and service delivery chain. And we understand that meeting that commitment requires us to both continuously evolve our solution with powerful new capabilities and continuously communicate to keep you informed of what’s new and how it can support your operations.
To ensure that you have a chance to not only read about but see these new capabilities in action, we also host a quarterly webinar where we demonstrate them and discuss others that are currently in the works. In hosting these sessions, we also seek to create a direct channel for our customers’ questions and to provide us with their valuable feedback.
As is usually the case, our quarterly update attempts to categorize the capabilities we’re highlighting according to some of the critical areas you’ve identified as posing distinct challenges. For this month’s blog and webinar, those categories are:
-
Taming Complex Collaboration Apps
-
Unlocking Operational Efficiency
-
Expanding Visibility Across Use Cases
-
Resolving App Issues from More Angles
With those categories in mind, let’s dive into the specifics.
Taming Complex Collaboration Apps
With hybrid work “the new normal,” the performance and availability of collaboration applications remain critical for IT organizations whose missions are to deliver the best experiences to their end users. ThousandEyes provides unparalleled visibility into essential applications, such as Webex by Cisco, Microsoft Teams, and Zoom, saving IT support and help desks significant time and effort in troubleshooting end user issues. Further enhancing our capabilities in this business-critical area, we're excited to announce two new features to give you expanded visibility with less management overhead.
Webex Calling Cloud Agents
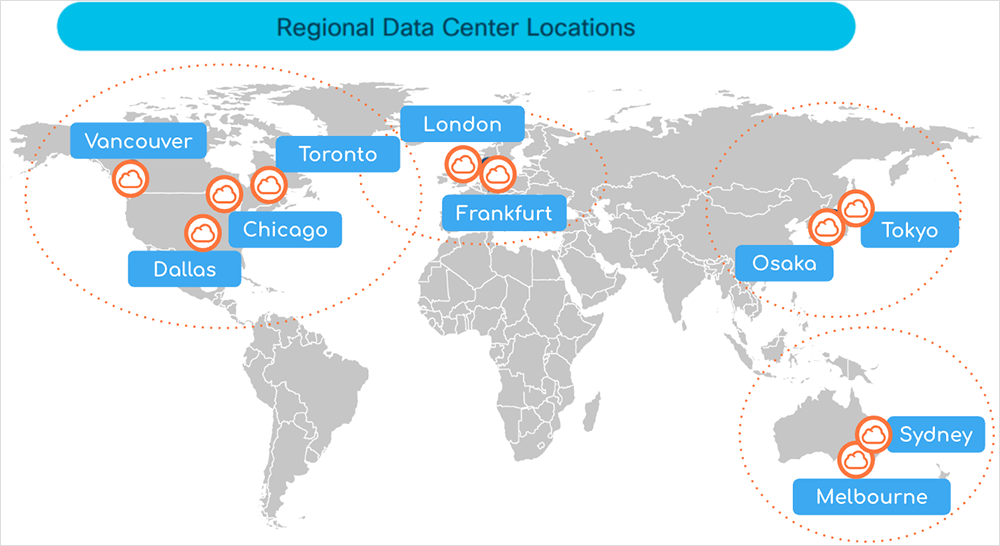
Last year, we deployed Cloud Agents within Webex data centers to provide customers with more accurate and bi-directional monitoring of the performance of critical Webex components. We are now expanding this performance monitoring capability to include Webex Calling by embedding ThousandEyes Cloud Agents within the Webex Calling infrastructure. This deployment will enable significantly more accurate information when performing network and RTP voice tests between your critical users and locations and Webex data centers.
This data can be seen within ThousandEyes test views and is consumable through Dashboard widgets. Please see the Webex Calling Best Practices Guide for more information.
Automated Session Tests: Auto-Detect Protocol
Monitoring critical collaboration applications has never been easier than with Automated Session Testing (AST) for End User Monitoring. ASTs give you the ability to monitor dynamic applications, such as Webex, Microsoft Teams, and Zoom, without having to configure which networks or IPs you need to monitor. ThousandEyes’ Endpoint Agent automatically discovers and maps which services an endpoint is connecting to as it initiates its session, as well as any changes occurring during this process.
To make this configuration even easier, a new protocol type—auto-detect—has been added within the New Test configuration. Auto-detect is becoming the default for new tests on the ThousandEyes platform. And to simplify even further, AST no longer requires you to specify ICMP vs. TCP when defining a test. Now, all you have to select is the application you want to monitor and from which agents. The end result eliminates any guesswork when setting up ASTs.
Unlocking Operational Efficiency
Ops workflows can be extremely complex and tedious, especially when the number of tools and processes required to get to the bottom of an issue or establish meaningful correlations between disparate datasets proliferates to a point where the laws of diminishing returns begin to kick in. To help you regain efficiency and streamline operations, we’re pleased to introduce a set of dashboard enhancements and a more standardized and efficient way to leverage ThousandEyes data with a broader selection of tools and platforms on the market today.
ThousandEyes OpenTelemetry
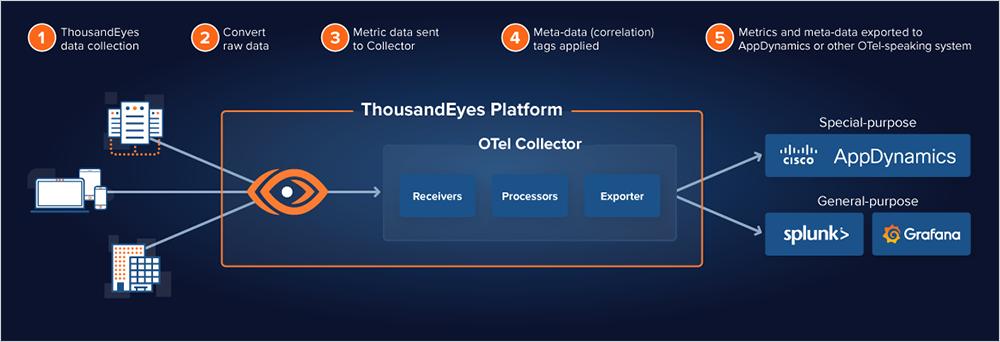
As the first network visibility solution to support OpenTelemetry, ThousandEyes is making it possible for you to export and interconnect ThousandEyes data across a wide range of solutions. ThousandEyes OpenTelemetry allows customers to send our network metrics in a standardized format to observability, analytics, and other platforms that support the de facto OpenTelemetry (OTel) standard.
Gaining insights from disparate observability domains requires contextual data correlation and speed—both of which are often critical when services are degraded. As part of the OpenTelemetry framework, ThousandEyes data is now tagged with correlation labels, enabling recipient systems to identify which test and application the ThousandEyes data applies to in order to facilitate correlation with external data sets.
ThousandEyes OpenTelemetry integrations unlock data portability and simplify ITOps workflows when tackling network and application performance issues. Network teams gain more flexibility and control over their data, enabling them to retain it longer and solve compliance issues related to data retention. Customers can even graph powerful visualizations and infer correlations across diverse data sets. Ultimately, this feature can help them resolve problems quicker and restore services faster.
You can use ThousandEyes OpenTelemetry in various scenarios where network data is integrated with other OTel-speaking ITOps tools. Doing so broadens visibility, accelerates troubleshooting, and supports compliance with data retention policies. Those tools might include:
- Data Visualization platforms—Enabling data from multiple systems to come together for insights that any single platform could not derive on its own
- Application Performance Monitoring (APM) and observability solutions—Providing a comprehensive view of issues affecting application performance
- Data platforms—Storing data for long retention periods in a flexible and efficient manner
Dashboard Labels + Dashboard API v7
In our last feature roundup, we highlighted our merging of dashboards and reports into one unified dashboard that lets customers view ThousandEyes test data and visualize it in more diverse ways. We’ve now expanded upon this capability in two areas.
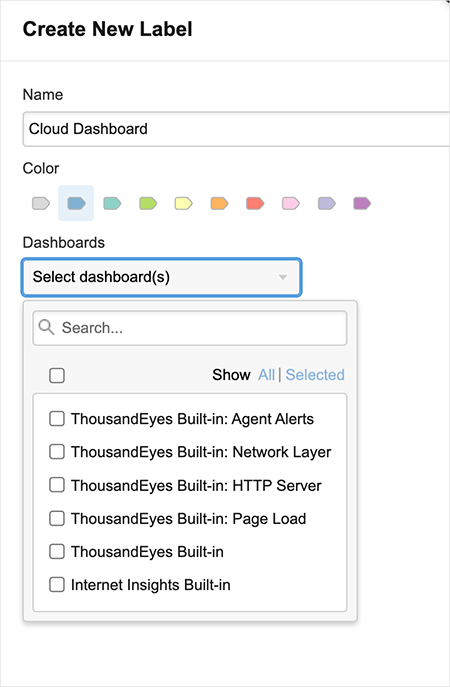
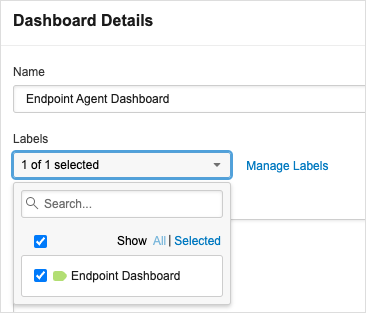
The first affects dashboard labels and allows you to tag dashboards for easier access or grouping by function or user scope. Much like the tags you can already use for ThousandEyes agents, you can now create tags and apply them to any dashboard you create. We have also added filters and search options that allow you to find dashboards more easily based on these tags.
The second way we’ve expanded our dashboard and reporting capabilities is by introducing a new version of our dashboard API. Dashboard API v7, currently in preview, brings several valuable enhancements to functionality for improved automation capabilities, as shown below in Figures 4 and 5.


The new API commands allow you to interact with the recently merged dashboards and reports view to create and update as well as manage snapshots programmatically. For more details on all of the API v7 capabilities, please visit the ThousandEyes Developer Documentation.
Expanding Visibility Across Use Cases
The rise of hybrid and remote work has led to a corresponding increase in ThousandEyes customers beginning to use or expanding their use of Endpoint Agents as a way to view end-to-end digital experience from the perspective of individual end users. Although employees greatly value the flexibility to work from anywhere, doing so in locations far removed from physical corporate help desks is not always conducive to high network and application performance.
To help address the digital experience of workers everywhere, we’re expanding ThousandEyes’ level of visibility into remote work environments through a set of enhancements to our Endpoint Agent. We are also broadening the number and types of SaaS applications we monitor to include more of those used by individuals from their laptops.
Endpoint Agent View Updates
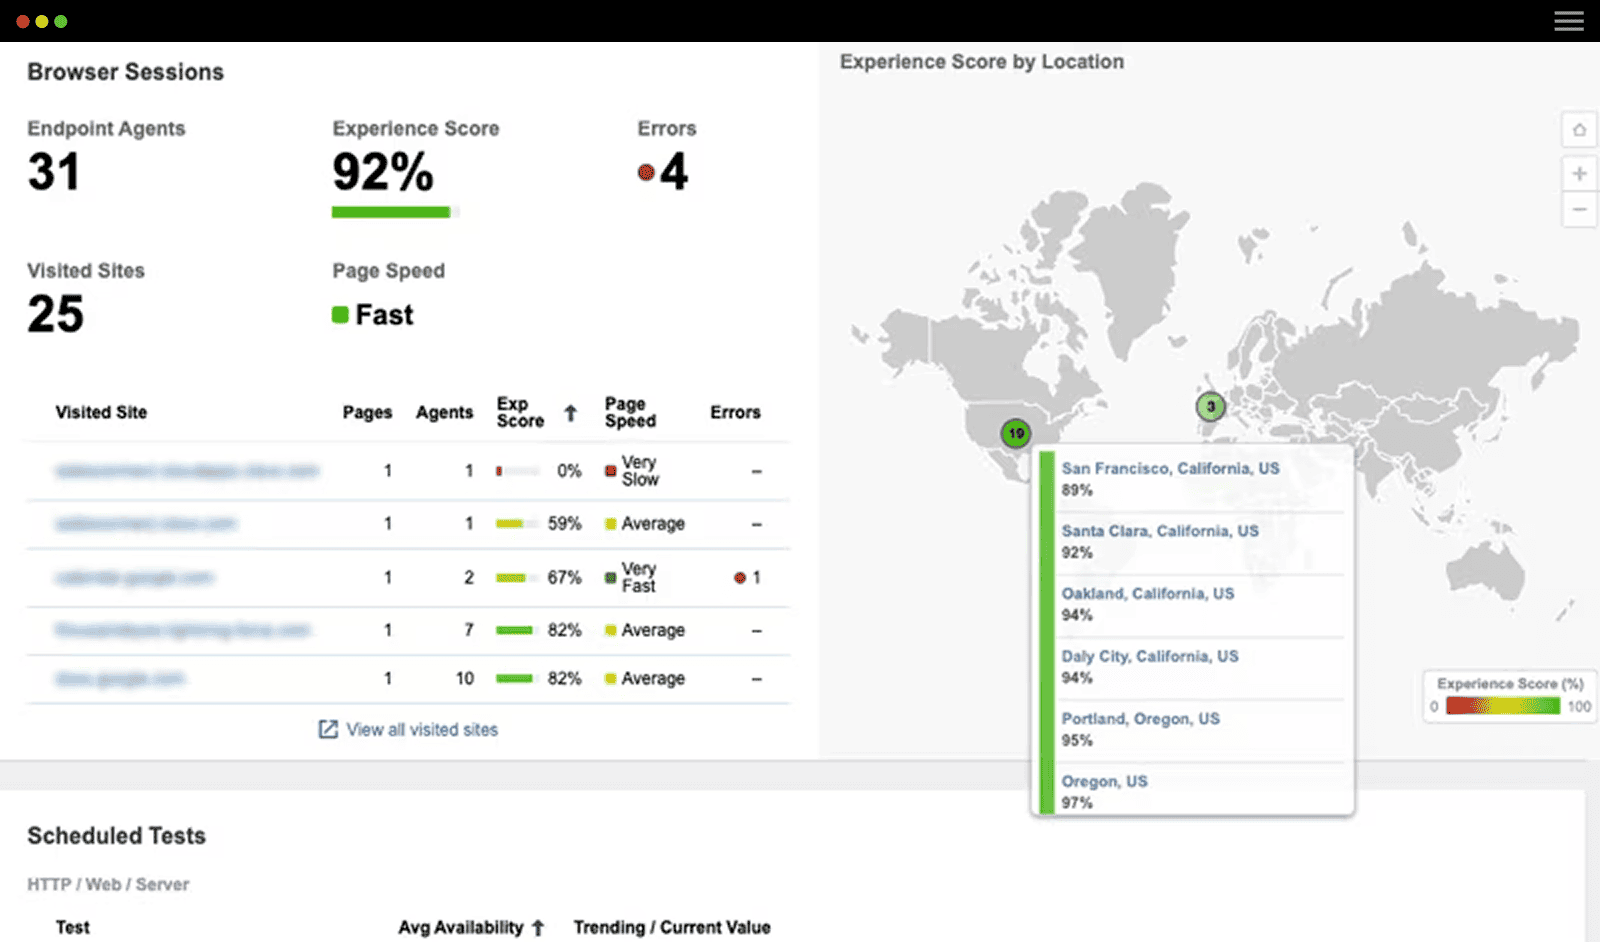
Our Endpoint Agent View gives you access to essential metrics associated with an end user running the ThousandEyes Endpoint Agent. This feature allows you to quickly identify where an issue may be occurring when a user is experiencing a drop in performance, either on their local machine or somewhere in the connection between them and the application.
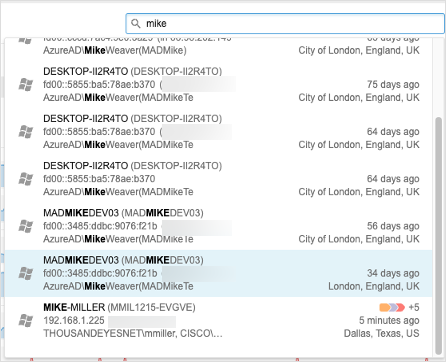
We’ve now expanded the search capabilities within the Endpoint Agent View to allow you to find endpoints by their username, hostname, or IP address (both private and public). Moreover, within the search screen, you will now see additional data to help you quickly identify the specific agent being investigated, such as last check-in time, geographic location, and user-defined labels.
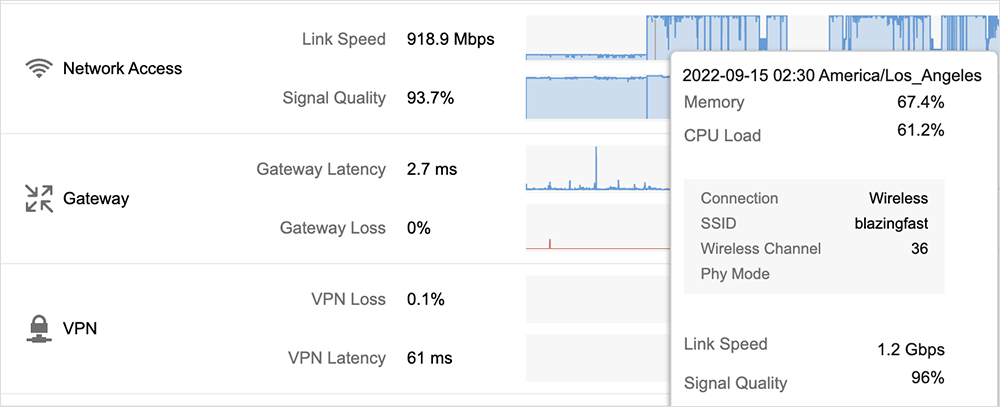
Another new feature customers have within the Endpoint Agent View is the ability to display and track wireless connection data and changes. You can now see metrics such as SSID, connection status, link speed, and signal quality to diagnose poor Wi-Fi connections or misconfigured networks rapidly.
Additional Endpoint Agent Statistics
When viewing results from an Endpoint Agent test, customers will notice we have incorporated the same statistics about connection status, link speed, and signal quality from the Endpoint Agent View. You can now quickly see physical wireless connection information along with latency and loss metrics to help you more precisely troubleshoot and measure the performance of end-user environments.
We’ve also added a filter option so you can display only agents that match certain performance criteria. And once you determine baseline values for normal performance, you can use an “any-or-all” filter in conjunction with network metrics, such as latency, loss, VPN loss, VPN latency, and jitter, to view any outliers. In this table view, you can also select specific agents to display, which is useful for viewing baseline data from endpoints with matching criteria.
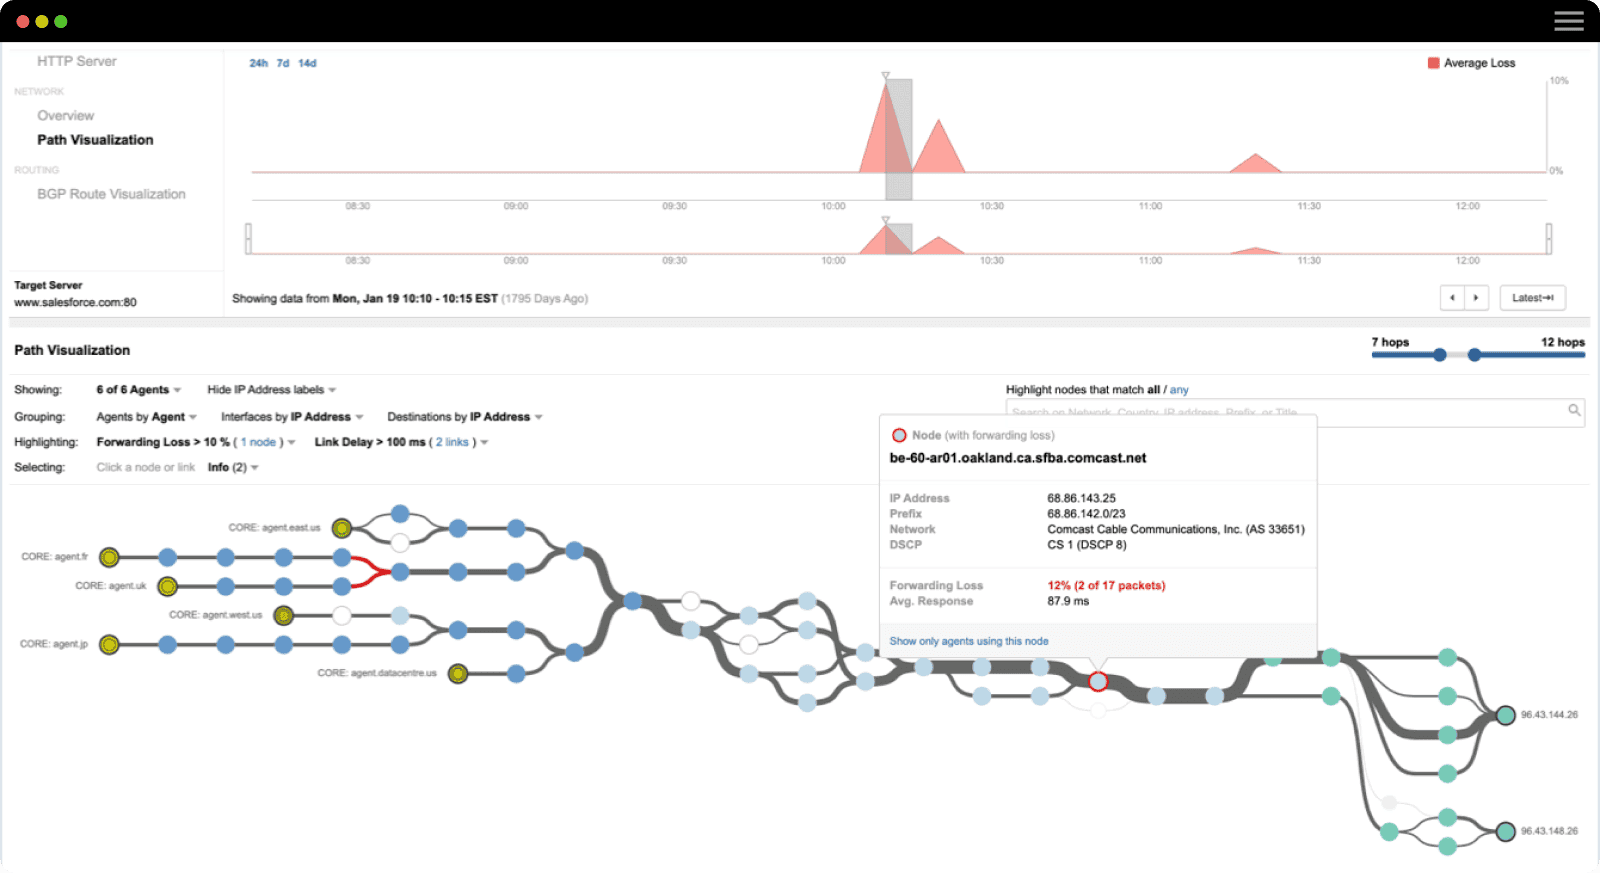
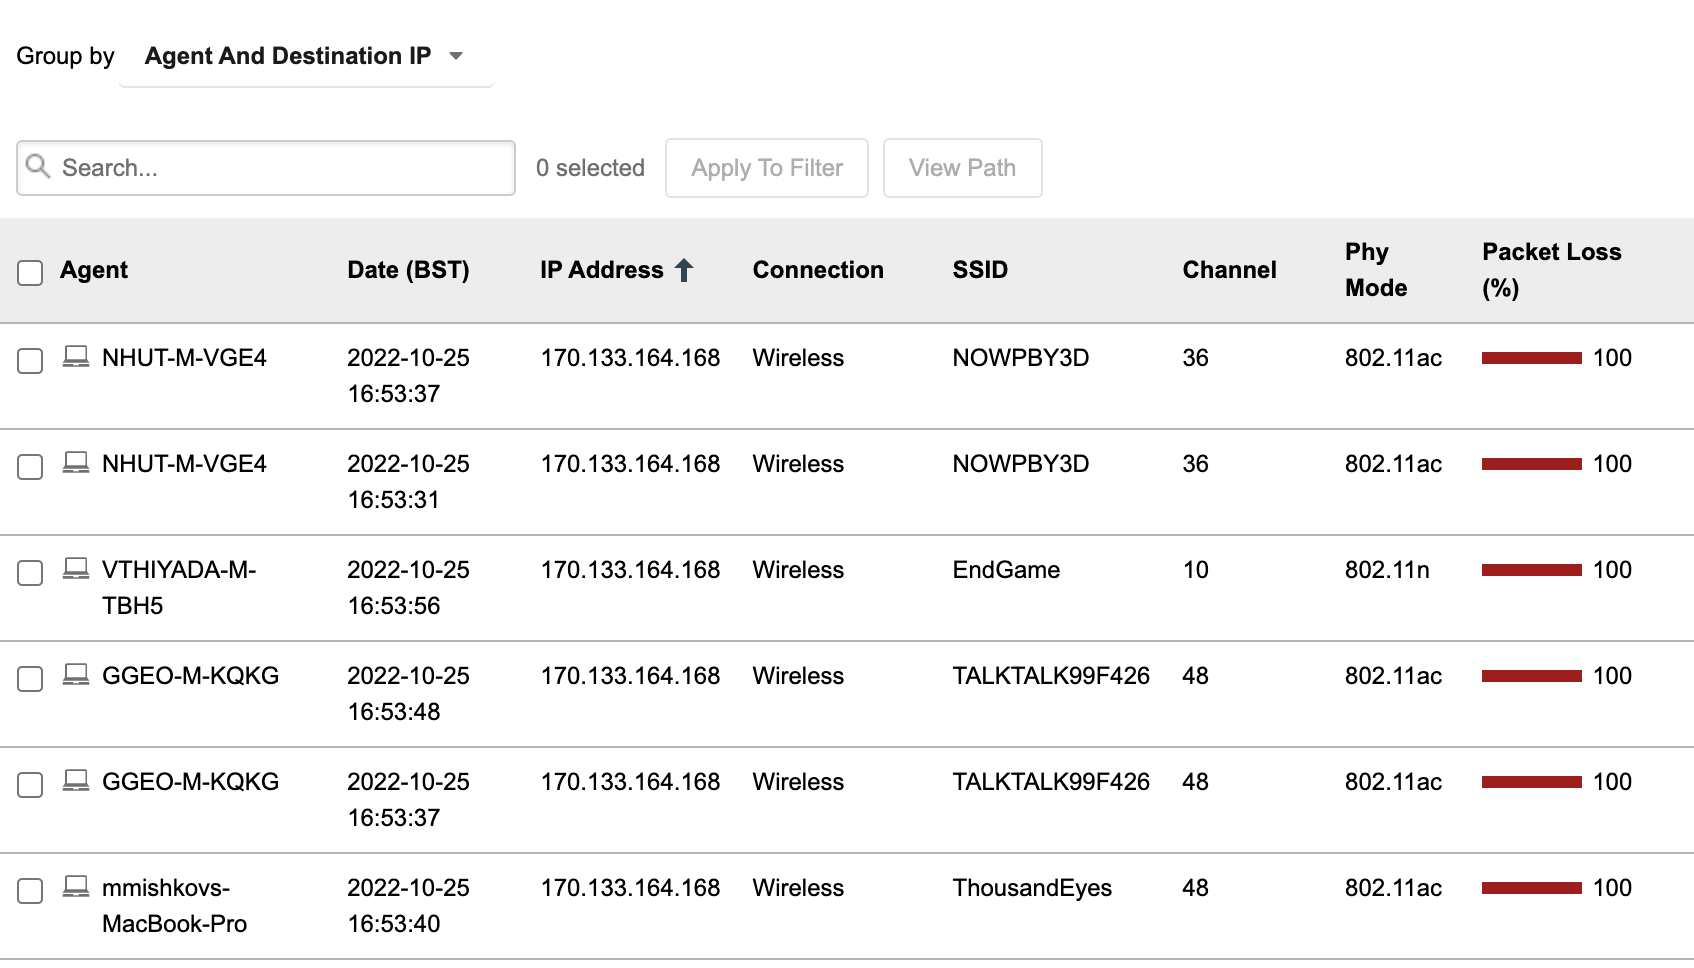
Lastly, we’ve added a group by agent and destination IP option to the ThousandEyes platform within our table view that lets customers see the impact of performance problems per destination server. If multiple users have reported issues, you can use this feature to see if they are connecting to the same destination, which may be experiencing an outage. This at-a-glance understanding helps you quickly narrow down what you might have thought was a machine-level or network issue to an application that is not responding properly.
Expanded SaaS Monitoring in Internet Insights
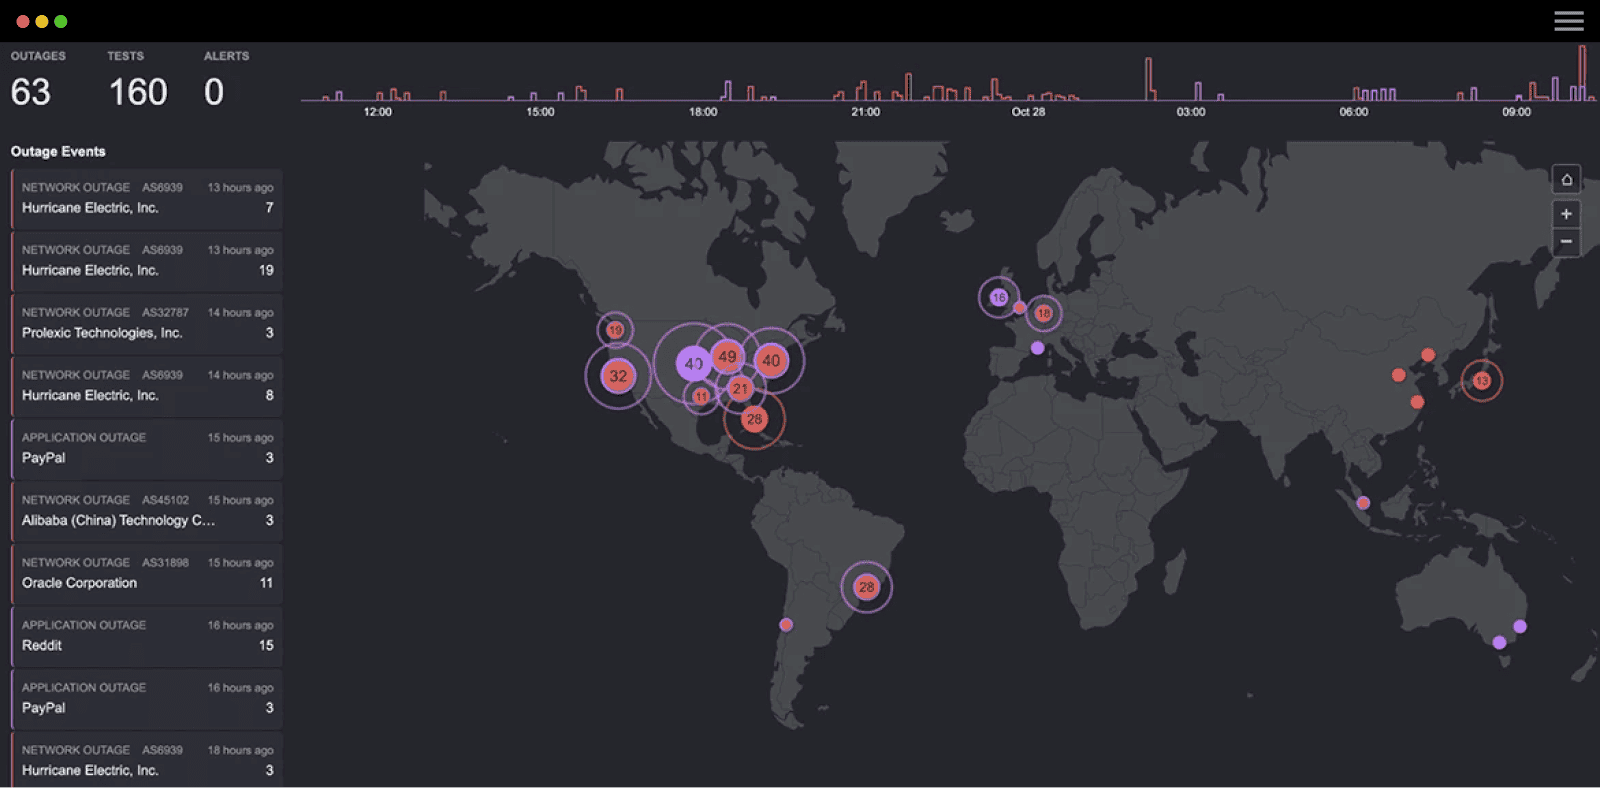
Internet Insights provides a global view of network outages and application outages, as seen from ThousandEyes’ vast network of agents across the Internet. The telemetry we collect and analyze continuously allows you to correlate performance issues you may be seeing to outages occurring on a larger scale. More critically, Internet Insights enables operations teams to identify, escalate, and remediate issues with providers more rapidly and with network-agnostic data to back them up.
The catalog of applications we track and monitor through Internet Insights constantly grows. Most recently, we added a new category—Streaming—which includes popular apps, such as HBO Max, Hulu, Netflix, and Spotify.
Additional applications have been added to existing categories as well: Cash App and Venmo (Finance), WhatsApp (Collaboration & Messaging), and TikTok (Social Media & Networking).
Resolving App Issues From More Angles
Browser synthetics lets you set up and run tests that emulate actual user interaction with your key applications. Running this capability gives you an accurate representation of loading elements on each part of an application so you can pinpoint exactly where performance issues may be negatively impacting operations.
Two tools used as part of ThousandEyes Browser Synthetics, BrowserBot and ThousandEyes Recorder, have become increasingly popular over time. Their ability to closely simulate end-user interactions, including browser-based transactions that have become a regular part of everyday Internet usage, makes them highly effective. We’re therefore pleased to introduce enhancements to BrowserBot and ThousandEyes Recorder.
New BrowserBot Options
BrowserBot is a core component of Browser Synthetics because it facilitates running tests and expands the number and types of options you can utilize within them. Below are a few recent additions we’ve made to the BrowserBot:
Disable Screenshots—Handled inappropriately, screenshots taken within a transaction test could expose confidential data, such as medical or financial information. So to provide additional privacy controls and prevent unwanted data exposures, customers can now disable screenshots on a per-test basis so unintended parties can no longer capture nor view this sensitive information.
Browser locale support—Browser tests now support Chrome’s “lang” flag, which allows you to set a specific language when rendering the page and monitor the associated performance.
Geolocation, Camera, and Microphone Emulation—By default, BrowserBot will block permission for these elements. However, you now have the option to have BrowserBot emulate a camera and a microphone for sites that request permission to use these. Customers can also emulate geolocation, which will give the site access to your agent vantage point locations to simulate a specific user location.
Page Load Strategy—You can now configure transaction tests with a page load strategy to help decrease test run times in situations where loading all of the individual website components before getting a result is not required. Page Load Strategy gives you the option to execute the next action without waiting for all the elements on the page to load. For example, you might have a page or application where the DOM is needed and loads quickly. But if JavaScript modifying the page or its assets take a long time to load, you may be forced to endure a lengthy wait before executing the next action on your transaction script. The wait is over with this new feature.
There are three major milestones for loading a web page: when the structure of the page (HTML) has been downloaded, when the major structural elements are present (DOMContent Loaded), and when images and other page assets have finished rendering (last contentful paint). Customers running tests on ThousandEyes Browser Synthetics with a page load strategy can look forward to three new options:
- Normal (default) - Wait for the entire page to load, meaning that HTML content and all resources have been downloaded and parsed before moving to the next action in the transaction test script.
- Eager - Wait for the DOMContentLoaded event, meaning that HTML content is downloaded and parsed and the document readiness state is “interactive” before moving to the next action in the test script.
- None - Wait only for HTML content to download. Once downloaded, the test proceeds to the next action in the transaction test script.
For more information on these new test options, please see the BrowserBot Test Settings Documentation.
ThousandEyes Recorder Upgrade
The ThousandEyes Recorder provides an integrated development environment (IDE) for creating, validating, and enhancing transaction test scripts based on your browser actions. And to assist our customers in conducting more granular role-based access based on job permission level, we have introduced two modes for the Recorder:
Standalone Mode—This mode requires minimal permissions to the ThousandEyes platform and allows a user to create and playback scripts, which they can use for transaction tests. However, it does not allow direct access to ThousandEyes test settings to add the tests. This feature is useful in scenarios where developers create the runbooks for tests, but a centralized body completes the review and implementation of these tests for tighter control.
Test Creation Mode—This mode functions similarly to Standalone Mode, except that users have additional options and access within the overall platform. In this mode, users can access existing shared credentials to user logins through scripts. Once the script is completed and validated, users in this mode can export a pre-configured test directly to ThousandEyes and specify browser options for that test, such as transaction timeout, microphone and camera permissions, geolocation permission, and exclusion of domains/URLs. This new mode allows for a seamless workflow between script creation and test implementation.
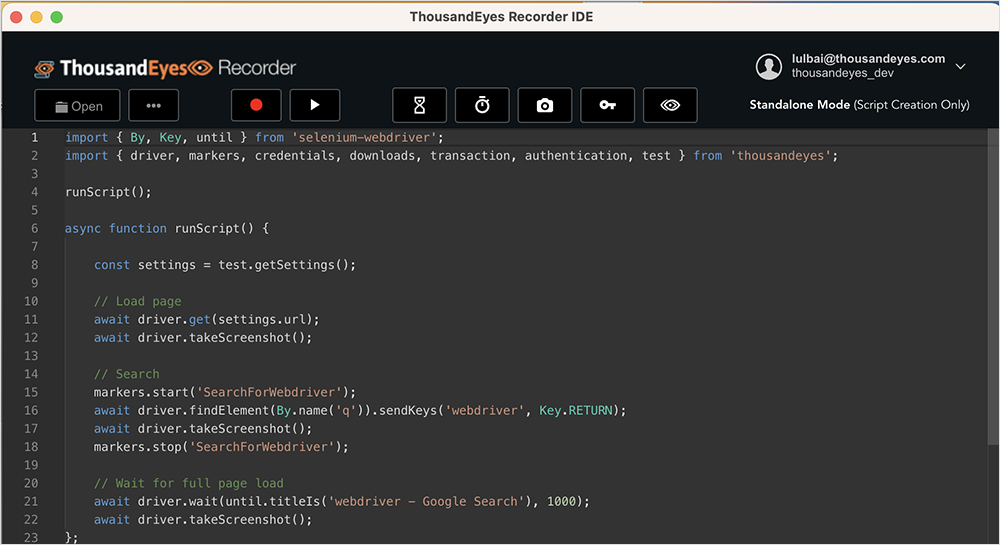
For more information on these new Recorder options, please see the ThousandEyes Recorder Documentation
ThousandEyes and Cisco AppDynamics Bidirectional Integration
When your customers are adversely affected by digital experience issues, IT teams need to quickly isolate whether they involve the user’s environment, the Internet path, the application, or the supporting cloud infrastructure. With the bi-directional integration between ThousandEyes and Cisco AppDynamics, you now have a powerful way to correlate business issues ranging from end-user experiences to application transactions and their dependencies with complete visibility into the network path and Internet routing.
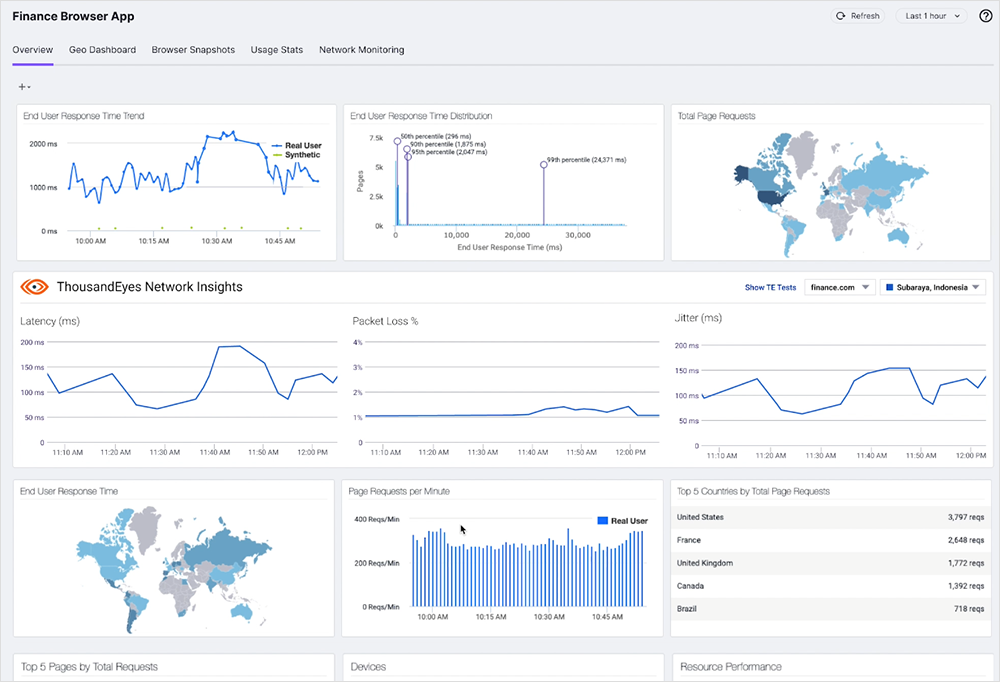
Within the ThousandEyes platform, customers can use this integration to automatically discover their monitoring environment from Cisco AppDynamics, which further enables ThousandEyes to detect external dependencies (for example, APIs) and offer monitoring recommendations based on potential gaps in coverage. In addition, you can utilize this integration to pinpoint unmonitored services related to business-critical applications. And to aid you in managing your recent discoveries, we’ve provided preconfigured templates that empower teams to quickly roll out tests to ensure appropriate monitoring coverage. ThousandEyes also generates streamlined views for ITOps teams, with convenient application-specific dashboards summarizing the health of critical services and all of their dependencies.
To take advantage of this new integration, users of ThousandEyes and Cisco AppDynamics must connect their respective accounts. Once linked, Cisco AppDynamics will automatically display metrics from ThousandEyes tests that correspond to the applications monitored by Cisco AppDynamics. As a result, users benefit from more streamlined workflows, and Ops teams are better equipped to determine the root cause of application performance issues, particularly when they’re network-related.
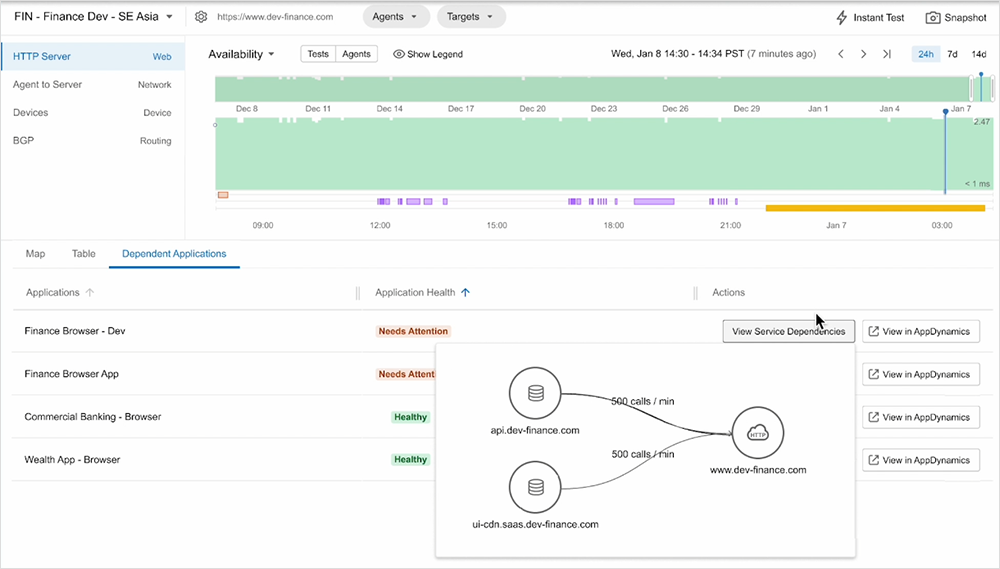
With ThousandEyes network insights displayed in the Cisco AppDynamics dashboard, teams investigating issues gain a more comprehensive and accurate view of digital experience due to the richer dataset made possible through this integration.
For additional information, refer to our solutions page covering the integration between ThousandEyes and Cisco AppDynamics.
