Welcome to the New Features Roundup, a blog series that highlights significant enhancements to the ThousandEyes platform. These updates are designed to increase the value you, our customers, derive from our solution across various use cases.
At ThousandEyes, our commitment is unwavering: we aim to provide you with the platform and products most capable of delivering the broadest visibility and insights. We know IT relies on our solutions to optimize digital experiences across their end-to-end application and service delivery chain. And we understand that meeting our commitment requires us to continuously evolve our solution with powerful new capabilities that we continuously communicate to keep you informed of what’s new and how it can support your operations.
To ensure you have a chance to not only learn about but see these new capabilities in action, we also host a quarterly webinar. In these webinars, we demonstrate our newest features and discuss others that are currently in the works. In hosting these sessions, we also seek to create a direct channel for our customers’ questions and valuable feedback.
As is our usual approach, our quarterly update attempts to organize the capabilities we’re highlighting according to some of the critical areas you’ve identified as posing your most pressing challenges. For this month’s blog and webinar, those categories are:
With those categories in mind, let’s dive into the specifics.
Watch the on-demand webinar to see these new capabilities in action.
New API Monitoring Test Type and Integrations
A significant focus for this round of feature updates is new features and enhanced capabilities for monitoring APIs. The modern web and its applications are built on APIs. Whether using API gateways, such as Amazon API Gateway, relying on third-party APIs, or deploying your own revenue-generating APIs, there is an ongoing need to monitor the performance of an increasing number of API endpoints at scale.
New Test Type - API Monitoring
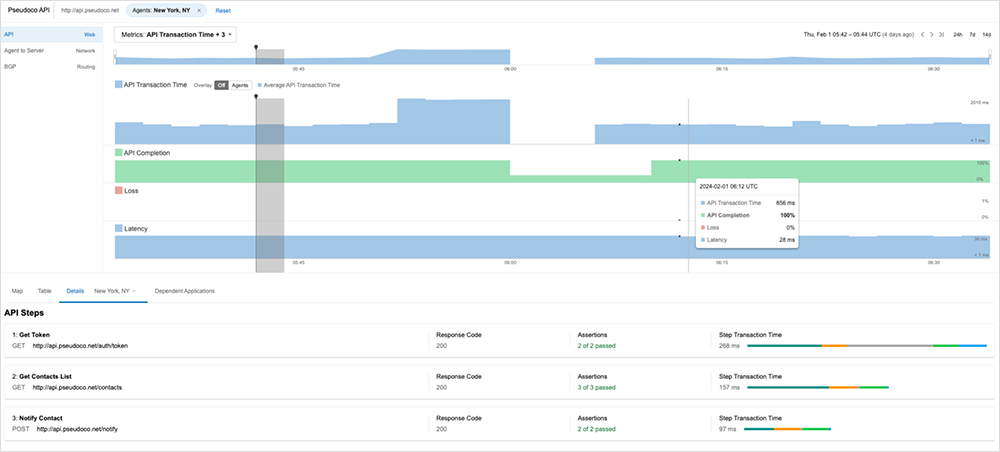
ThousandEyes is expanding its API monitoring capabilities with a new test type specifically designed to monitor API endpoints. This new test type offers SRE, DevOps, and NetOps teams a scalable mechanism to deploy complex API monitoring quickly and to gain detailed visibility into the performance of each API call.
This new test is easy to configure using the step builder within the UI. You can set up simple API transactions or you can configure and chain together multiple API calls, with the ability to pass information between each step.
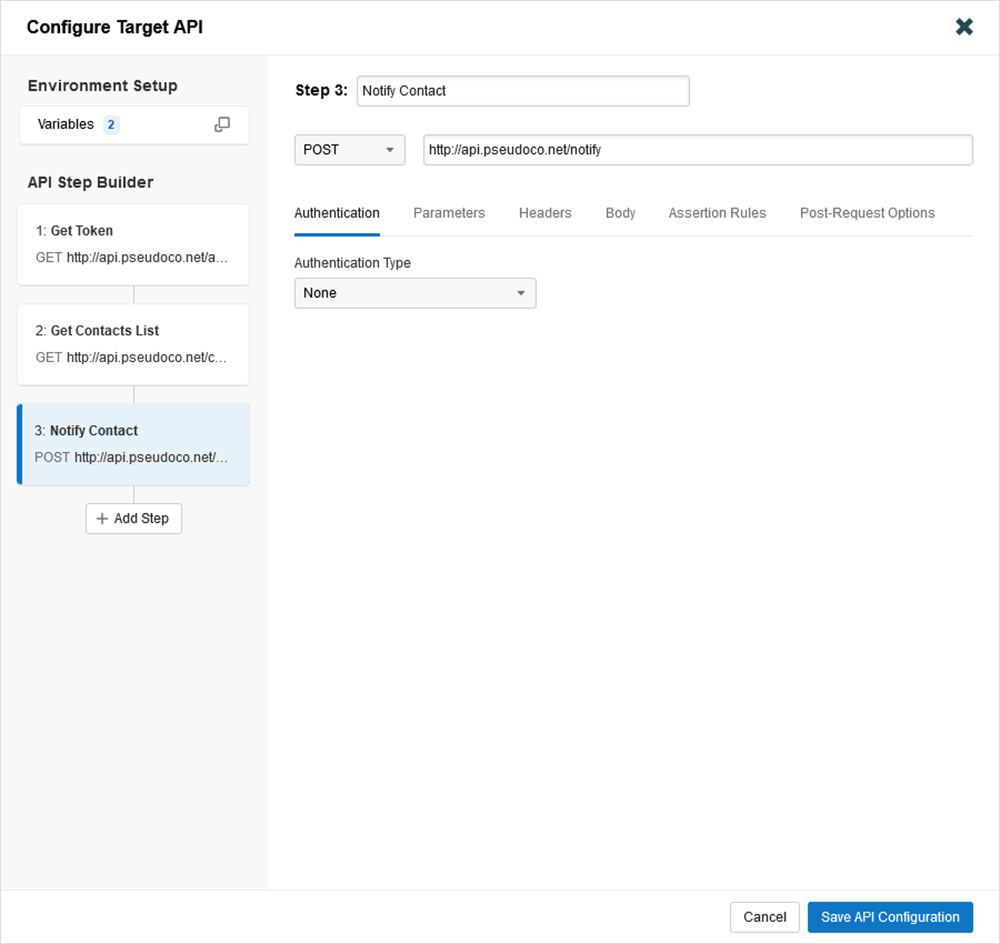
When viewing the results from an API test, you can see the overall API performance as well as the performance and response results from each individual step. This capability can help teams pinpoint the exact failed API request, making troubleshooting much easier.
AWS API Gateway Recommendations
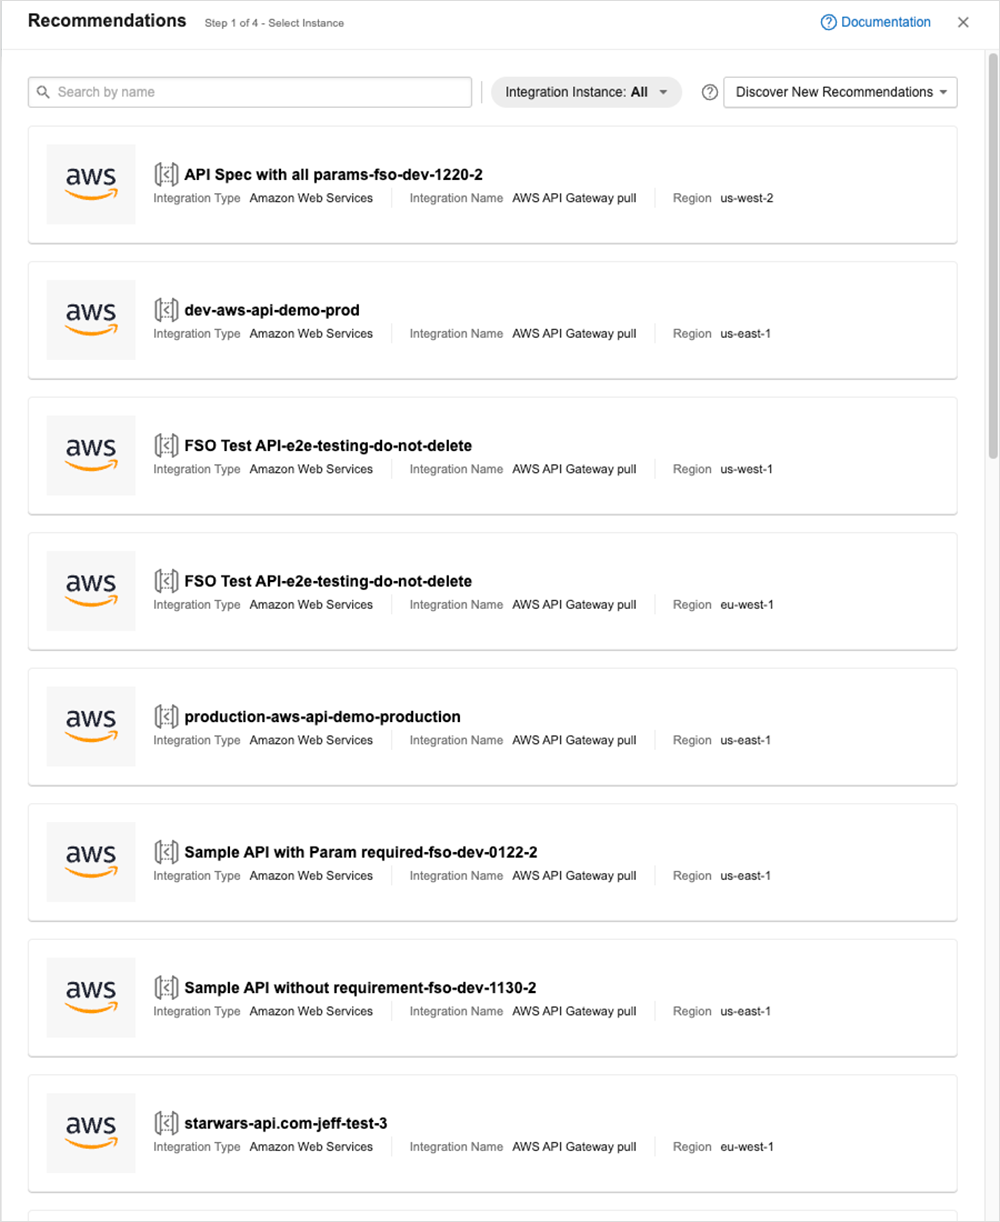
The AWS Test Recommendations for API Gateway helps users of this Amazon service by discovering a customer’s relevant API endpoints and creating easily deployable test templates with the complete API requirements to begin monitoring API performance easily. This capability helps teams provide scalable performance assurance for Amazon API Gateway services.
This integration is easy to set up, and once you’ve linked your AWS account in the Integrations menu, ThousandEyes will automatically provide test recommendations based on the configured API Gateway endpoints.
When adding a new test from recommendations, you can select from all the discovered API Gateway instances. Then, within each recommendation, you can choose the individual API calls to deploy tests.
ThousandEyes Endpoint Monitoring Enhancements
The next set of features focuses on improvements and new innovations with the ThousandEyes Endpoint Agent. These bring enhanced capabilities to help monitor end-user performance from many device types and to many different services and applications, allowing you to help ensure the best user experience and providing proactive performance metrics to address a problem before it occurs.
Cisco Secure Access - Experience Insights
Experience Insights, a central feature of Cisco Secure Access, empowers ITOps teams to diagnose and resolve connectivity and performance issues rapidly. This critical component, embedded within the Security Service Edge (SSE) solution and powered by ThousandEyes, is crucial for managing digital experiences both inside and outside the corporate network.
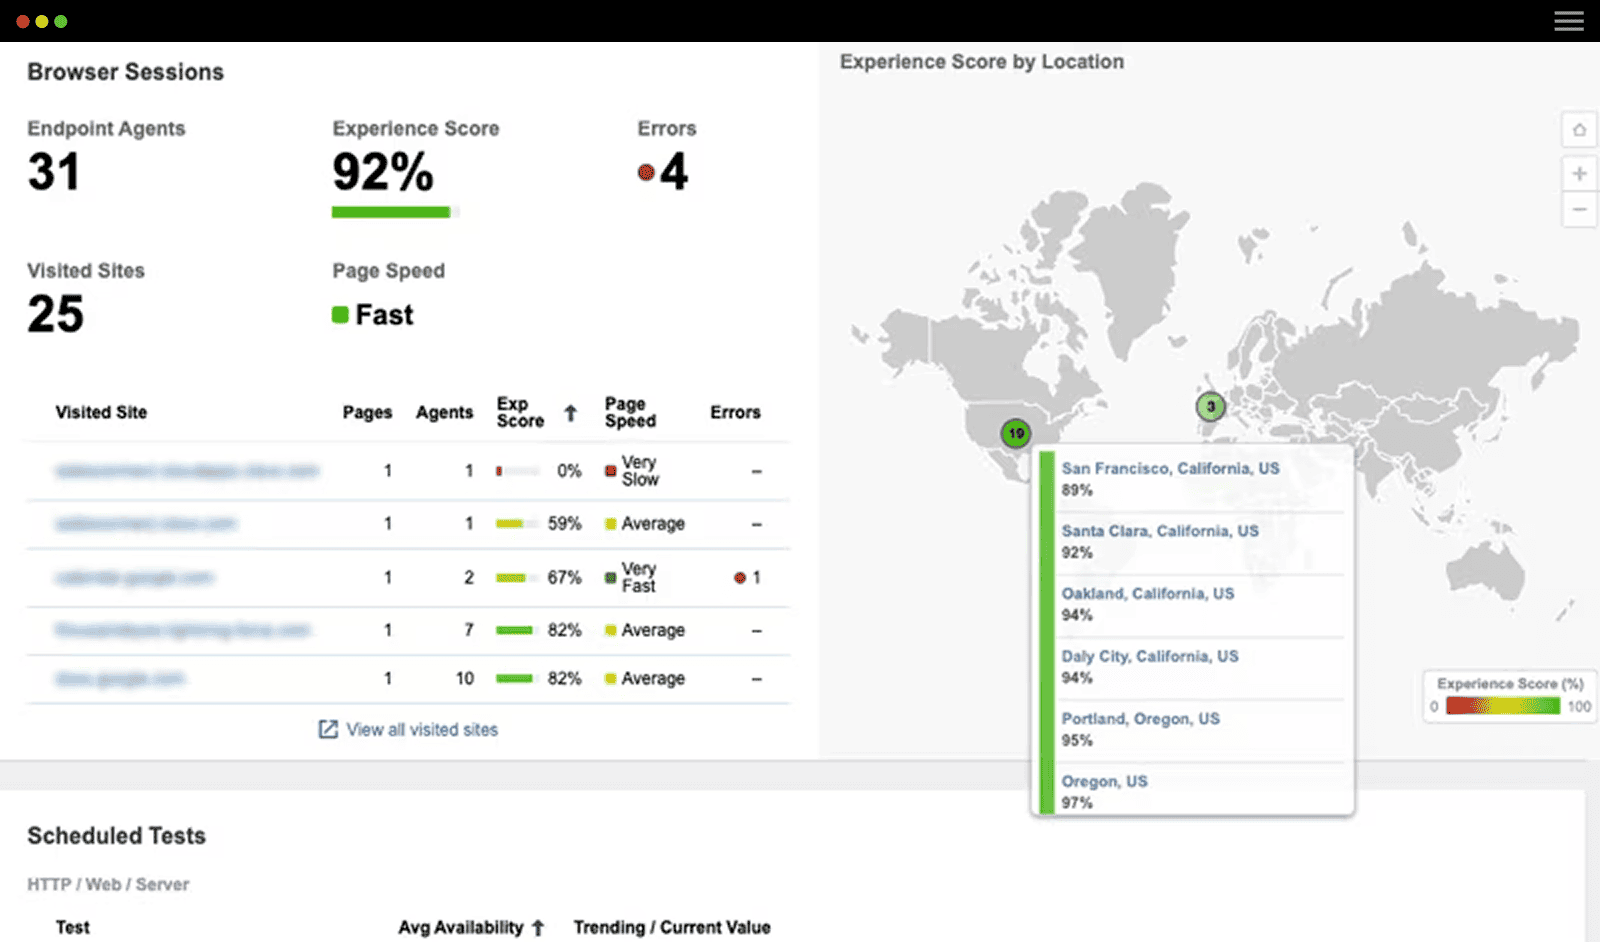
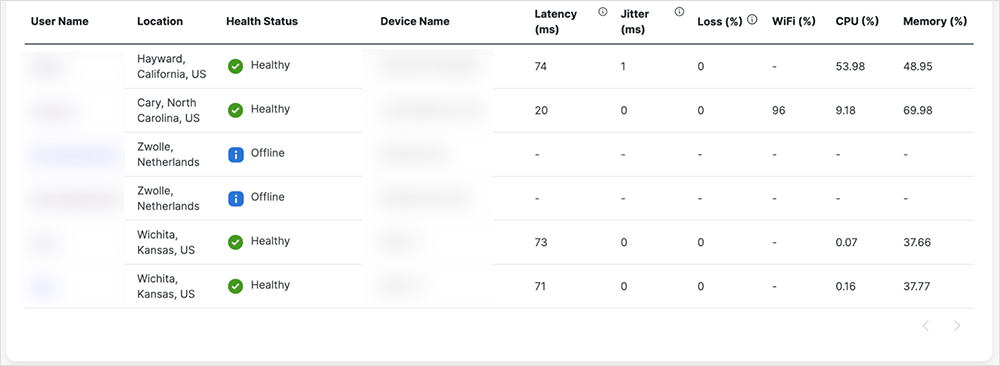
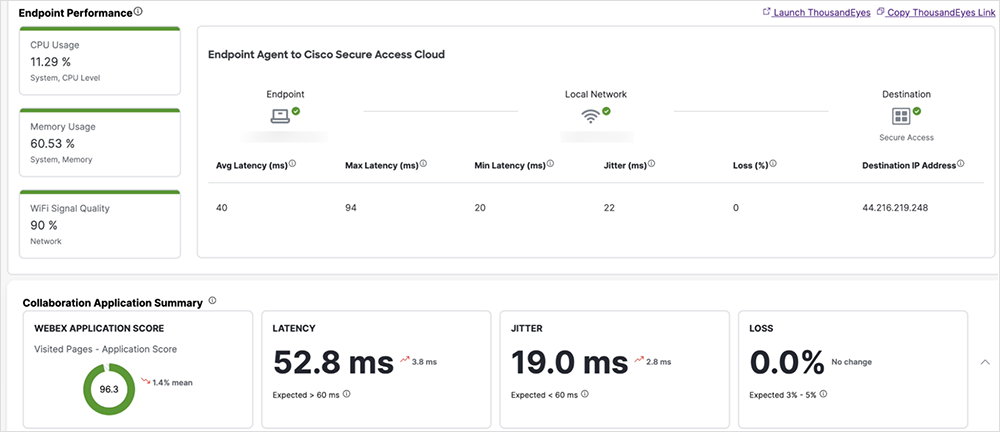
Within the Secure Access portal, administrators get an overview of overall device health status and key network and device metrics. This dashboard makes it easy to identify and troubleshoot any stressed or malfunctioning devices quickly.
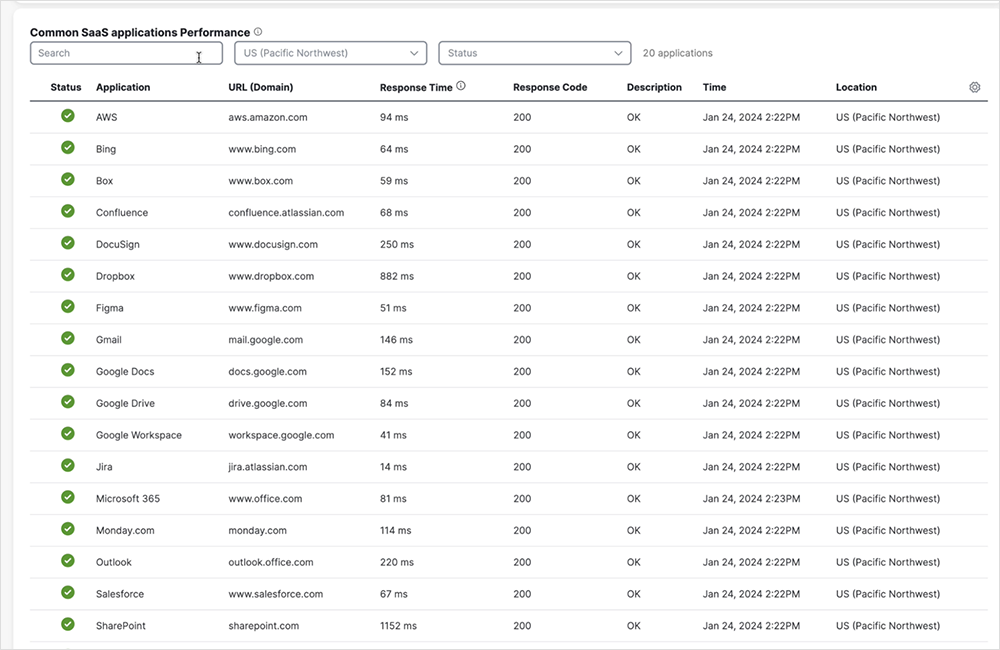
The overview page also provides a glimpse into overall Internet health by surfacing the performance of the top 20 most popular SaaS applications. We take these measurements from multiple ThousandEyes global vantage points. With them, we can help administrators understand if a user’s problem is more localized or due to a more extensive application outage.
Lastly, the client details screen lets you view more specific performance metrics about a single user and their device. This new view includes device client or OS version details, system-level performance such as CPU and memory utilization, and key network stats. The path between the endpoint and the Secure Access hub is displayed, along with the performance information for the connection. Finally, the Secure Client automatically performs tests to gauge the performance of common collaboration applications, such as Webex by Cisco. The detailed results are visible in this view, enabling administrators to determine whether any network connectivity issues were negatively affecting user experience.
New Endpoint Test Setup Workflow
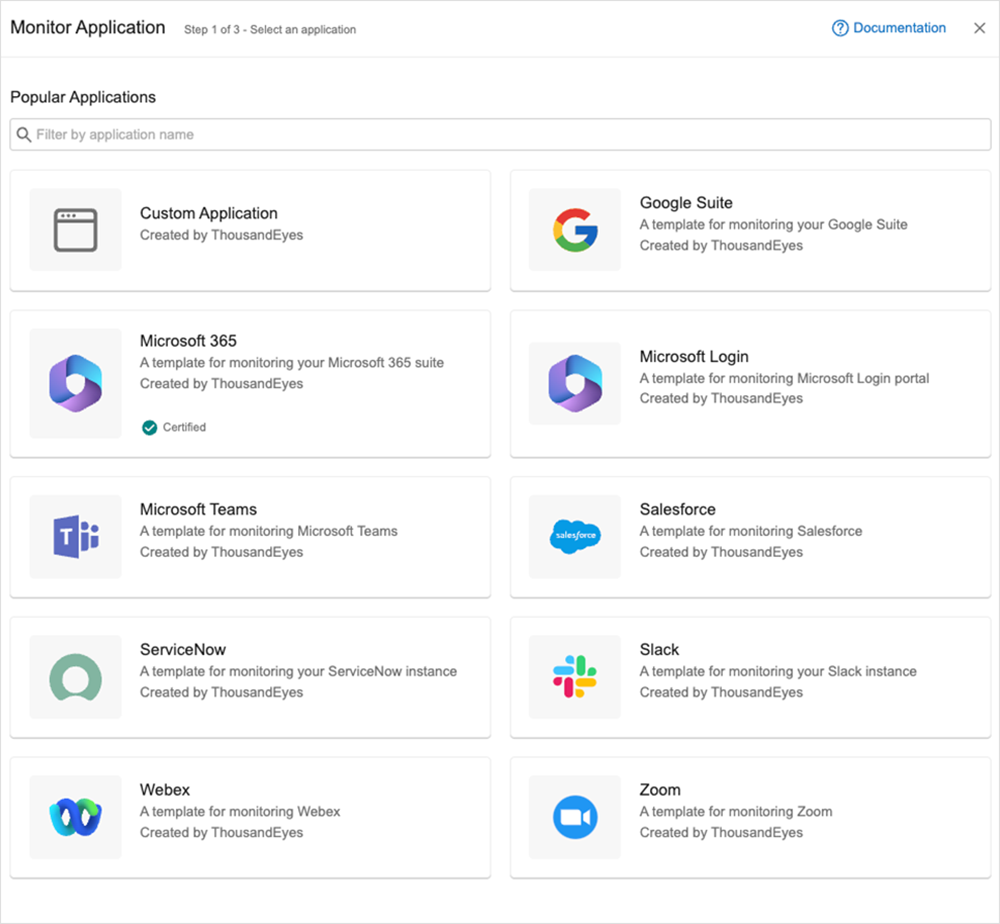
To further streamline the process of setting up synthetic tests for ThousandEyes Endpoint Agents, we’ve introduced a new wizard-driven experience within the Test Settings configuration page. This innovation makes it even easier to set up monitoring for common SaaS applications using pre-defined templates that contain all of the necessary domains and settings needed. For added convenience, each certified template comes with a best-practice guide that covers the test setup and monitoring strategy for each application. You also have the flexibility to add custom templates, allowing you to define your own applications and then re-use those configurations to set up additional tests swiftly.
Webex Dynamic Test Updates
The Webex dynamic test (previously known as the Automated Session Test) has been updated to harness new session detection algorithms, which enhance accuracy when measuring meeting performance from endpoint clients. Additionally, this test now supports all of the Webex meeting types, including:
-
Webex Meeting
-
Webex Calling to PSTN
-
Call on Webex (Locus call)
-
Webex video integration for Microsoft Teams (VIMT)
These improvements to the test make monitoring the performance of Webex sessions on user devices even more straightforward, enabling proactive feedback if any performance issues arise.
ThousandEyes Enterprise Agents in Webex Video Mesh Network Clusters
Cisco Webex Video Mesh (VMN) delivers better call experiences by keeping meeting connections on premesis, which minimizes latency and reduces Internet bandwidth consumption. The ThousandEyes Enterprise Agent is now directly embedded on servers within a VMN cluster and can be enabled and automatically deployed from Webex Control Hub. This enables better visibility into the network path from VMN servers to the Webex cloud, as well as from clients to the VMN cluster, allowing you to build a deeper understanding of the performance and quality of your Webex VMN environment.
For more details, see the Webex VMN and ThousandEyes Deployment Guide.
Platform Innovations
The final set of features focuses on core functionality of the ThousandEyes platform. These enhancements amplify capabilities for API access and automation, enable new dashboard troubleshooting use cases, and offer network administrators valuable capacity planning information for their SD-WAN deployments.
API v7
Our v7 API introduces new capabilities for developers and DevOps-focused customers, ranging from standardization to performance and improved documentation. It aims to deliver a single cohesive API surface for all ThousandEyes product areas. The goal of our v7 API is to simplify and improve use cases while increasing interoperability with tools common to operations workflows. We’ve standardized HTTP verbs and resources, error codes, and adopted HATEOAS to ease discoverability. This endeavor has also greatly improved API performance and the volume of data that can be returned in a single call, which can help speed up automation use cases.
Along with adopting Cisco API best practices, our improved documentation, powered by Open API Specifications, is now hosted on Cisco DevNet, enabling a consistent experience for developers. A Postman collection is also available to use directly within the solution.
Dashboard Filters
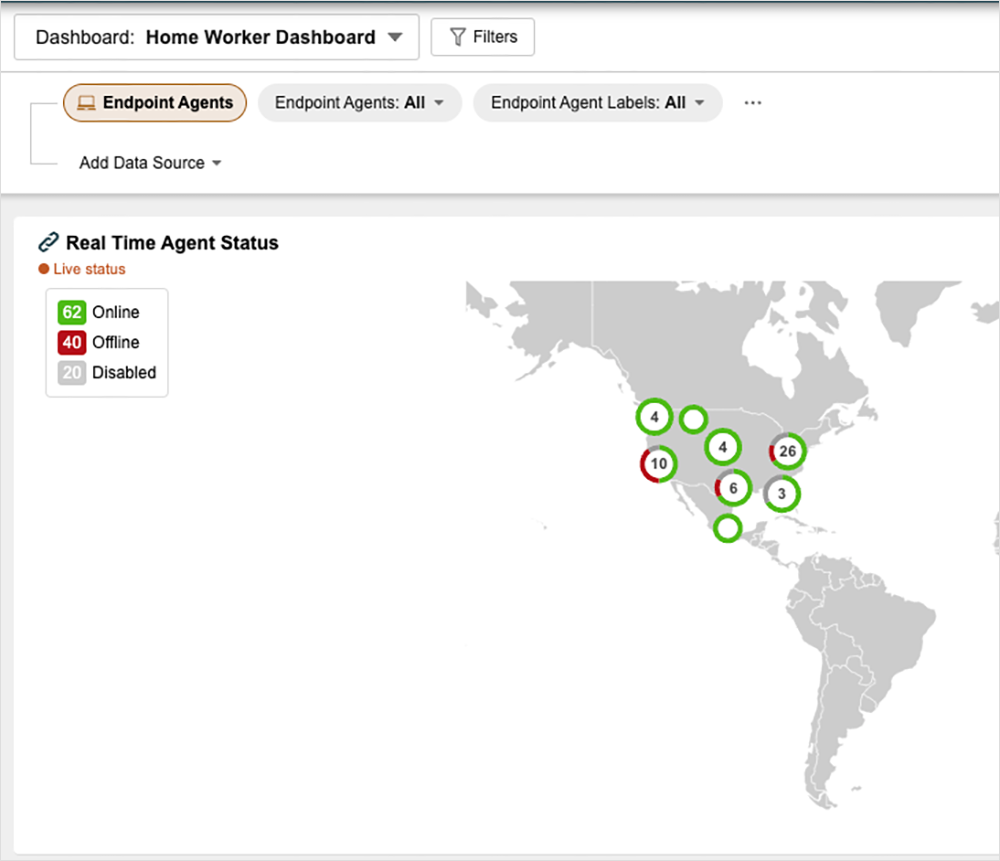
The Dashboard Filters feature enhances the usability of the dashboard for troubleshooting and investigation. It allows administrators to configure a dashboard and then pivot all of the data and displays to target a specific dataset, such as location, user group, or service. These filters can be saved for future use, thereby creating a library of saved services that can facilitate rapid pivoting in your investigative work.
Creating filters is straightforward, and they can be applied to all of the available widgets on a dashboard. This simplifies the process of quickly pivoting a dashboard to a specific set of agents, Endpoint Agents, tests, users, locations, alerts, servers, and more. Each widget also offers the option to be locked so that the selected filters don’t apply to it, which allows certain figures and information to remain static.
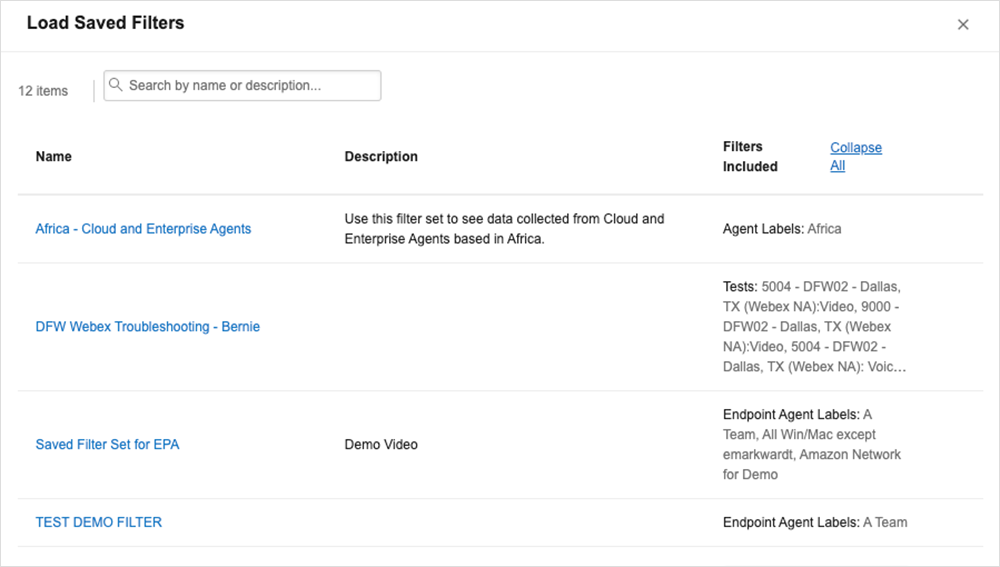
Once you’ve created a filter set, you can save it for later use. When selecting the Load Saved Filters option, the platform will present you with a list of all your previously created filters including their name, description, and filter criteria. This capability makes it easy to recall certain dashboard presets or initiate an investigation with certain sets of data.
WAN Insights Capacity Planning
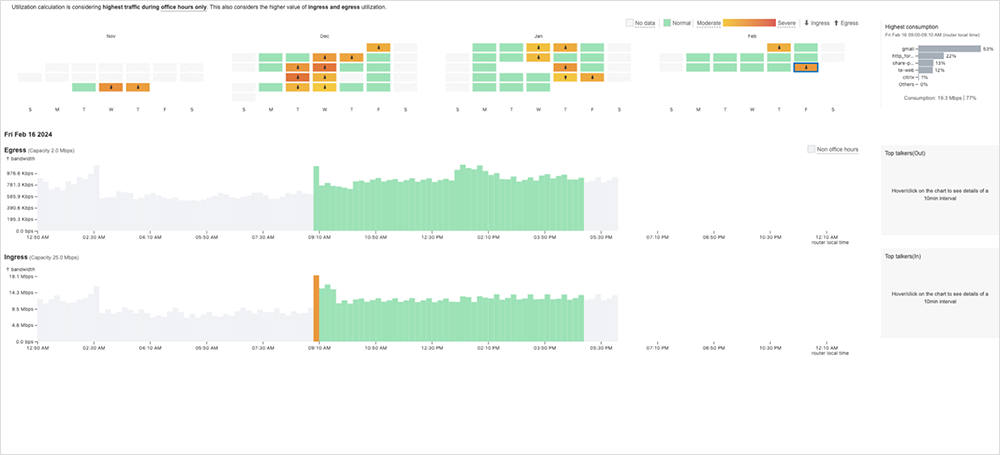
We’ve introduced a new feature, Capacity Planning, to WAN Insights to help IT and Network Ops teams understand circuit capacity and utilization across all of their SD-WAN sites. Administrators can input circuit capacity information, after which WAN Insights will track overall utilization across the sites and on each individual network device.
The Capacity Planning feature also offers a list of Top Talkers, providing insights into different types of traffic or applications that are consuming the most bandwidth at a site. This information can help inform QoS policy decisions or proxy and firewall settings, particularly if there are certain applications that are consuming a lot of resources that should not be permitted.
This information can be viewed in detail for each interface and also through an overview heat map, which aids in quickly identifying sites that are at or over capacity. This data can also be filtered by office hours to only show data during a typical work day. Alerts and warnings, with configurable thresholds, can be enabled to proactively notify administrators when utilization exceeds a certain level.
Connect With Us To Learn More
We are excited by the prospect of sharing even more improvements during our next ThousandEyes New Features Roundup. Should you have any questions about the topics discussed here, you can reach out to your Cisco representative or contact us directly.
Also, we encourage you to connect with the larger ThousandEyes user community on our new Support Community. For those looking to further engage with ThousandEyes and enjoy some fun challenges, join our Cisco Insider community and earn rewards for your participation.
