In our previous blog post, users learned how to create ThousandEyes network tests and start streaming the telemetry data to any observability backend using OpenTelemetry.
At the time of writing that document, Prometheus did not support ingesting OpenTelemetry data. However, starting from version 2.47, Prometheus now supports ingesting OpenTelemetry data natively using the feature flag --enable-feature=otlp-write-receiver. More information can be found here.
This blog post will cover the necessary steps for sending data from ThousandEyes directly to Prometheus using OpenTelemetry.
Prerequisites:
-
Prometheus version 2.47 or higher
-
SSL certificate signed by a trusted certificate authority (CA) for Prometheus
-
ThousandEyes API token to perform the API request. You can find more information in the ThousandEyes Developer Reference.
Step 1: Create a ThousandEyes HTTP Network Test
Before we can send ThousandEyes metrics over OTel, we need to capture some test data. So the first step is to create a ThousandEyes HTTP network test, as shown below:
curl -L 'https://api.thousandeyes.com/v7/tests/http-server' -H 'Content-Type: application/json' -H 'Authorization: Bearer $BEARER_TOKEN' -d '{
        "interval": 60,
        "agents": [
          {"agentId": 121}
        ],
        "testName": "OpenTelemetry Test",
        "url": "www.cisco.com",
        "alertsEnabled": 0
      }'
The response will contain a “testId” that you must provide in the next step. In our case, the testId is 281474976713933.
Step 2: Create an Integration
Now that we have data available, let’s create the streaming integration to Prometheus.
curl -v -XPOST https://api.thousandeyes.com/v7/stream -H "Content-Type: application/json" -H "Authorization: Bearer $BEARER_TOKEN" -d '{
  "type": "opentelemetry",
  "testMatch": [{
    "id": "281474976713933",
    "domain": "cea"
  }],
  "endpointType": "http",
  "dataModelVersion": "v1",
  "streamEndpointUrl": "https://<your-domain>:<your-port>/api/v1/otlp/v1/metrics",
  "customHeaders" : {
    "Authorization": "Basic <PASSWORD>"
  }
}'
Note: As you can see in the Prometheus documentation, the OTLP receiver datapoint is /api/v1/otlp/v1/metrics.
You can also create the stream using the ThousandEyes platform. Click here for more information on how.
Step 3: Receive Data in Prometheus
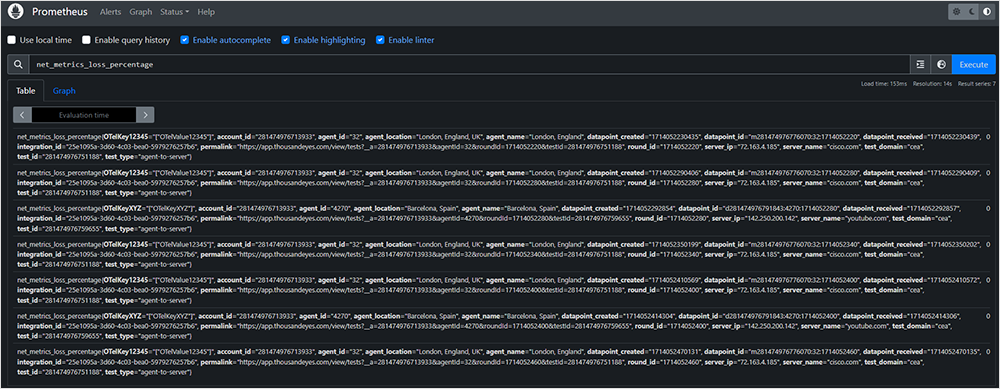
Now you can start receiving your ThousandEyes telemetry data on your Prometheus instance, as shown in Figure 1.

Note: Prometheus instance needs to have a valid SSL certificate signed by a trusted certificate authority (CA) and feature flag --enable-feature=otlp-write-receiver enabled.
Please refer to Prometheus documentation for HTTPS and authentication configuration steps.
Step 4: Visualize Data in Grafana
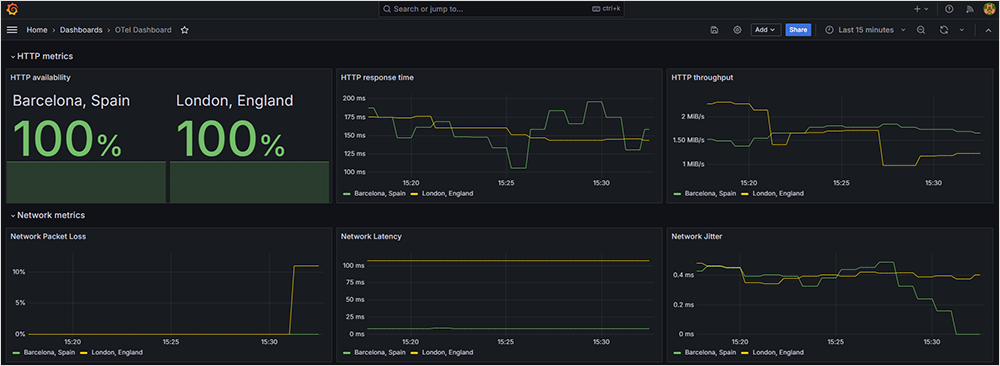
After getting data to Prometheus, you can configure your Prometheus instance as a data point in Grafana and visualize the data, as shown in Figure 2.

Note: Please refer to Grafana documentation on how to add Prometheus as a data source.
You can import the ThousandEyes dashboard from this file ThousandEyes+Grafana_model.json and follow this guide to install.