When it comes to monitoring your IT infrastructure, device-based SNMP monitoring has long been the go-to solution. However, as technology continues to advance, alternative approaches have emerged that enhance visibility and improve issue resolution, which are increasingly important in the Internet age.
In this blog, we are intentionally focusing on the key differences between device-based SNMP monitoring and synthetic end-to-end monitoring, which platforms like ThousandEyes offer, rather than exploring other methods like flow. By understanding these distinctions, you can better appreciate how end-to-end synthetic monitoring complements existing monitoring strategies, provides better solutions to unique use cases, and helps provide a clearer path to resolving issues.
The Differences
To establish a shared understanding as we delve into this topic, let's define the two types of monitoring this blog will address:
- Simple Network Management Protocol (SNMP) monitoring collects device-specific metrics data, including CPU utilization, memory usage, and interface statistics. Organizations primarily use it to manage individual devices within a network, such as routers, switches, and servers.
- Synthetic end-to-end monitoring gathers and analyzes connection data between multiple points, with a focus on monitoring network performance and availability. ThousandEyes comprehensive approach spans local networks and the Internet, providing a broader view of network health and performance.
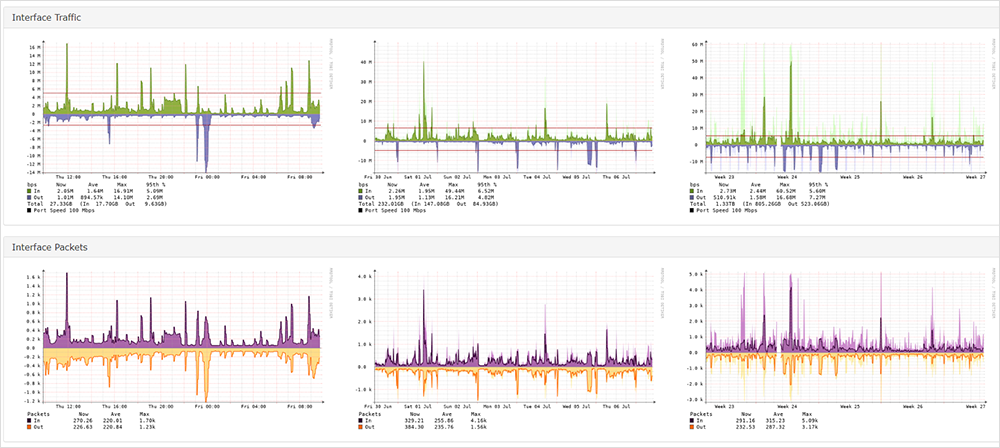
Differences between these two monitoring techniques can impact how network administrators troubleshoot their networks. Let's consider a scenario where there is an issue within the network, such as a faulty cable, a broken switch or switch port, or a failed router.
In such a situation, SNMP-based monitoring would typically notify me of any faulty devices or if a device metric exceeded a predefined threshold. But that's the extent of the information, as shown in Figure 1.

Straightforward, right?
However, what if there was no specific "faulty device," and someone simply complained about poor performance from point A to point B? In such a case, the network administrator would be faced with two options: either manually inspect each potential device along the path for port metrics, or disregard the request and hope that the issue resolves itself while everyone continues to blame to network.
This scenario gets even worse when you don’t own the device and you can’t monitor it because you don’t have SNMP to it (perhaps because it’s in the cloud).
More Vantage Points
When there is an issue, sure, you could run ping and traceroute to identify the problem. Yet, this reactive approach only allows you to investigate the issue after it has occurred, making it impossible to compare the before and after states. Furthermore, you cannot proactively respond because you don't know when the issue initially arose. So, network administrators become reliant on someone or something reporting the problem before taking action.
And this is where ThousandEyes' synthetic end-to-end monitoring comes into play. ThousandEyes offers three types of monitoring vantage points to cater to different perspectives IT may need:
- Cloud Agents are pre-provisioned and positioned within various cloud providers and deliver an "outside-in" view of externally visible targets.
- Enterprise Agents, deployed within your network or on network devices, provide an "inside-out" view to targets outside of the network (such as a SaaS app) or an "inside-to-inside" view to other targets within your network.
- Endpoint Agents reside on end user workstations and offer simplified tests towards both internal or external targets.
Let's consider the Enterprise Agent as an example. By configuring a test from the Enterprise Agent to a target like https://cisco.webex.com/, you can gather performance data spanning from your network to the target. The dashboard in Figure 2 shows that the test data includes valuable insights, such as packet loss, latency, and jitter.

Not only will you obtain data from the agent to the target, but also you will have visibility into latency and packet loss between each network hop. This comprehensive view help you to pinpoint whether an issue resides within your network or on the broader Internet, as shown in Figure 3.

Once an issue is identified, such as a packet loss, you can pinpoint exactly where it is occurring. In Figure 4 below, you can see that one of the tests experiences packet loss within the Webex network. With this information, you can work alongside your provider to resolve the issue more quickly.

Now, there can certainly be scenarios in which you could use SNMP-based device monitoring to complement a synthetic end-to-end monitoring approach. For example, it could be used when an issue arises on a specific device within your own network.
Here's a little-known fun fact for these instances: Within ThousandEyes, we collect some metric data using SNMP from support routers, switches, firewalls, load balancers, and wireless access points that expose standard SNMP MIBs. Figure 5 shows where those insights are available on the platform.
